

Optical Spectroscopy Instrumentation Design
185
solutions, powders, and thin films and apply to a wide range of applications including, for
example, fluorescent materials for whiteners and white lights, organic and inorganic lightemitting diode materials, biology, fluorescent probes and quantum dots, laser threshold
requirements, determining suitability of wavelength shifters, and for studies of radiationless transitions in molecular systems. There are a variety of methods for measuring QYs,
and many of these have been described in the literature (Resch-Genger et al., 2007). The
measurement of absolute quantum yields is difficult owing to the range in experimental
errors that need to be avoided or compensated for. Relative quantum yields are more commonly measured by comparing an unknown sample to that of a sample with a known QY
in the same spectral region. In this case, the accuracy of the unknown QY is determined by
that of the known reference sample. As in all fluorescence measurements, care is needed
to minimize interactions occurring within the sample that could impact on the QY. Such
factors include inner filter effects and factors affecting the fluorophore’s microenvironment
such as temperature, solvent, pH, presence of dissolved oxygen and other quenchers, polarity, viscosity, and fluorophore binding. All of these are capable of introducing significant
errors to QY determination. Because the efficiency of the fluorescence process within a
given sample is determined by the QY, this parameter is of major importance. The QY is
essential for the calculation of quenching-rate constants, radiative and nonradiative rate
constants, and energy transfer. In essence the QY is needed to help describe or define the
samples photo-physical behavior (Fery-Forgues and Lavabre, 1999).
Measuring the true QY of any fluorophore is complex. One approach is to use an integrating sphere (IS). In this, the sphere is hollow, with entrance and exit ports, and the interior is
coated with a diffuse reflective coating. Light scattered by the interior of the IS is uniform
and evenly distributed over all angles. As a result the flux (total power) of any light source
can be measured without errors caused by complex optical geometries and arrangements.
600
650
550
500
Wavelength (nm)
P3
Intensity
P2
L3
L2
second experiment
third experiment
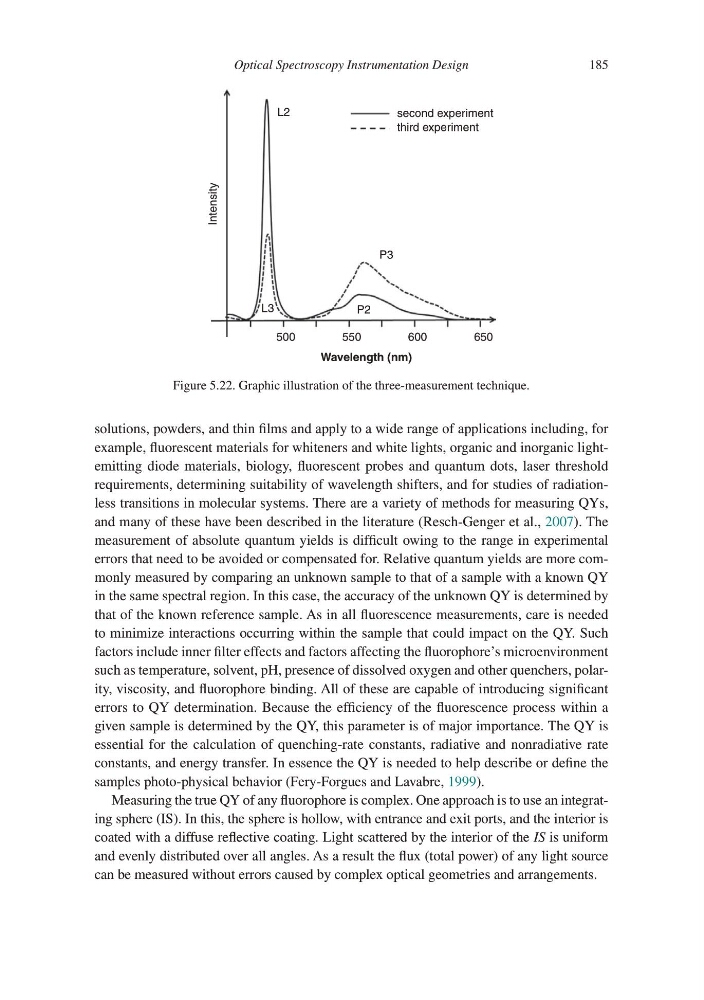
Figure 5.22. Graphic illustration of the three-measurement technique.
185
solutions, powders, and thin films and apply to a wide range of applications including, for
example, fluorescent materials for whiteners and white lights, organic and inorganic lightemitting diode materials, biology, fluorescent probes and quantum dots, laser threshold
requirements, determining suitability of wavelength shifters, and for studies of radiationless transitions in molecular systems. There are a variety of methods for measuring QYs,
and many of these have been described in the literature (Resch-Genger et al., 2007). The
measurement of absolute quantum yields is difficult owing to the range in experimental
errors that need to be avoided or compensated for. Relative quantum yields are more commonly measured by comparing an unknown sample to that of a sample with a known QY
in the same spectral region. In this case, the accuracy of the unknown QY is determined by
that of the known reference sample. As in all fluorescence measurements, care is needed
to minimize interactions occurring within the sample that could impact on the QY. Such
factors include inner filter effects and factors affecting the fluorophore’s microenvironment
such as temperature, solvent, pH, presence of dissolved oxygen and other quenchers, polarity, viscosity, and fluorophore binding. All of these are capable of introducing significant
errors to QY determination. Because the efficiency of the fluorescence process within a
given sample is determined by the QY, this parameter is of major importance. The QY is
essential for the calculation of quenching-rate constants, radiative and nonradiative rate
constants, and energy transfer. In essence the QY is needed to help describe or define the
samples photo-physical behavior (Fery-Forgues and Lavabre, 1999).
Measuring the true QY of any fluorophore is complex. One approach is to use an integrating sphere (IS). In this, the sphere is hollow, with entrance and exit ports, and the interior is
coated with a diffuse reflective coating. Light scattered by the interior of the IS is uniform
and evenly distributed over all angles. As a result the flux (total power) of any light source
can be measured without errors caused by complex optical geometries and arrangements.
600
650
550
500
Wavelength (nm)
P3
Intensity
P2
L3
L2
second experiment
third experiment
Figure 5.22. Graphic illustration of the three-measurement technique.