

Optical Spectroscopy Instrumentation Design
167
0.1
100
90
80
70
60
50
Efficiency - %
40
30
20
10
0
100
90
80
70
60
50
Efficiency - %
40
30
20
10
0
0.3
0.5
0.7
0.9
Wavelength - µm
45 degrees
Reflectance of Aluminium
Reflectance of Aluminium
Reflectance of Aluminium
Reflectance of Aluminium
P - Plane
S - Plane
1.2
1.6
2.0
2.4
0.1
100
90
80
70
60
50
Efficiency - %
40
30
20
10
0
0.3
0.5
0.7
0.9
Wavelength - µm
45 degrees
1.2
1.6
2.0
2.4
0.1
0.3
0.5
0.7
0.9
Wavelength - µm
1.2
1.6
2.0
2.4
100
90
80
70
60
50
Efficiency - %
40
30
20
10
0
P - Plane
S - Plane
0.1
0.3
0.5
0.7
0.9
Wavelength - µm
1.2
1.6
2.0
2.4
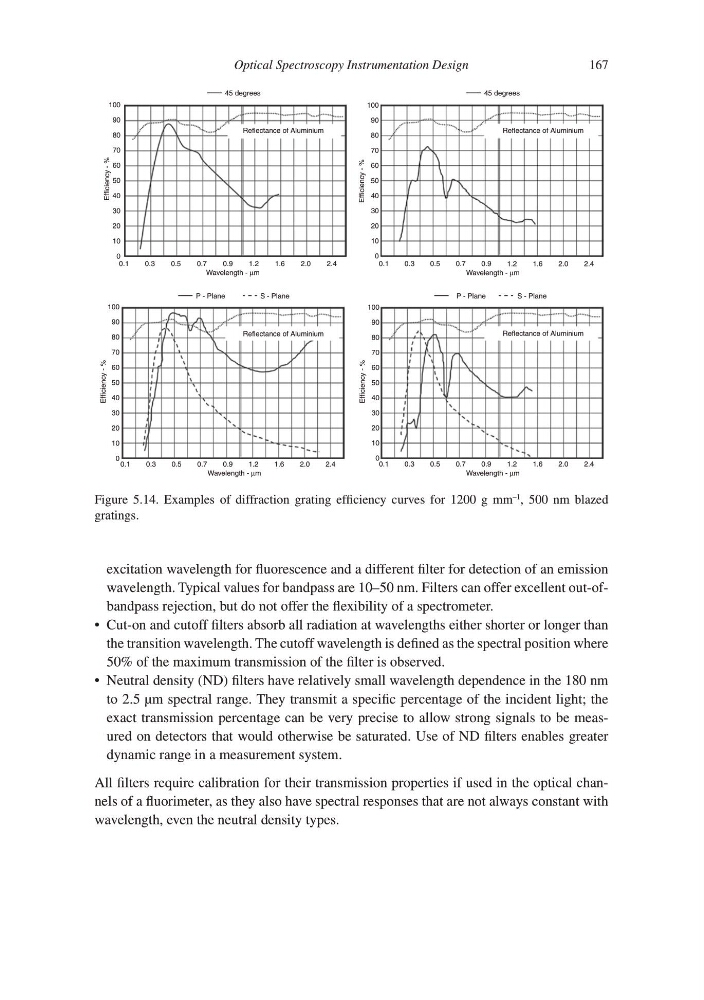
Figure 5.14. Examples of diffraction grating efficiency curves for 1200 g mm
–1
, 500 nm blazed
gratings.
excitation wavelength for fluorescence and a different filter for detection of an emission
wavelength. Typical values for bandpass are 10–50 nm. Filters can offer excellent out-ofbandpass rejection, but do not offer the flexibility of a spectrometer.
Cut-on and cutoff filters absorb all radiation at wavelengths either shorter or longer than
•
the transition wavelength. The cutoff wavelength is defined as the spectral position where
50% of the maximum transmission of the filter is observed.
Neutral density (ND) filters have relatively small wavelength dependence in the 180 nm
•
to 2.5 μm spectral range. They transmit a specific percentage of the incident light; the
exact transmission percentage can be very precise to allow strong signals to be measured on detectors that would otherwise be saturated. Use of ND filters enables greater
dynamic range in a measurement system.
All filters require calibration for their transmission properties if used in the optical channels of a fluorimeter, as they also have spectral responses that are not always constant with
wavelength, even the neutral density types.
167
0.1
100
90
80
70
60
50
Efficiency - %
40
30
20
10
0
100
90
80
70
60
50
Efficiency - %
40
30
20
10
0
0.3
0.5
0.7
0.9
Wavelength - µm
45 degrees
Reflectance of Aluminium
Reflectance of Aluminium
Reflectance of Aluminium
Reflectance of Aluminium
P - Plane
S - Plane
1.2
1.6
2.0
2.4
0.1
100
90
80
70
60
50
Efficiency - %
40
30
20
10
0
0.3
0.5
0.7
0.9
Wavelength - µm
45 degrees
1.2
1.6
2.0
2.4
0.1
0.3
0.5
0.7
0.9
Wavelength - µm
1.2
1.6
2.0
2.4
100
90
80
70
60
50
Efficiency - %
40
30
20
10
0
P - Plane
S - Plane
0.1
0.3
0.5
0.7
0.9
Wavelength - µm
1.2
1.6
2.0
2.4
Figure 5.14. Examples of diffraction grating efficiency curves for 1200 g mm
–1
, 500 nm blazed
gratings.
excitation wavelength for fluorescence and a different filter for detection of an emission
wavelength. Typical values for bandpass are 10–50 nm. Filters can offer excellent out-ofbandpass rejection, but do not offer the flexibility of a spectrometer.
Cut-on and cutoff filters absorb all radiation at wavelengths either shorter or longer than
•
the transition wavelength. The cutoff wavelength is defined as the spectral position where
50% of the maximum transmission of the filter is observed.
Neutral density (ND) filters have relatively small wavelength dependence in the 180 nm
•
to 2.5 μm spectral range. They transmit a specific percentage of the incident light; the
exact transmission percentage can be very precise to allow strong signals to be measured on detectors that would otherwise be saturated. Use of ND filters enables greater
dynamic range in a measurement system.
All filters require calibration for their transmission properties if used in the optical channels of a fluorimeter, as they also have spectral responses that are not always constant with
wavelength, even the neutral density types.