

Sampling Design for Organic Matter Fluorescence Analysis
135
Days
0
10 20 30 40 50 60 70 80 90 100
Days
0
10 20 30 40 50 60 70 80 90 100
% change fluorescence intensity
–30
–25
–20
–15
–10
–5
0
5
(a)
(b)
% change fluorescence intensity
–60
–55
–50
–45
–40
–35
–30
–25
–20
–15
–10
–5
0
5
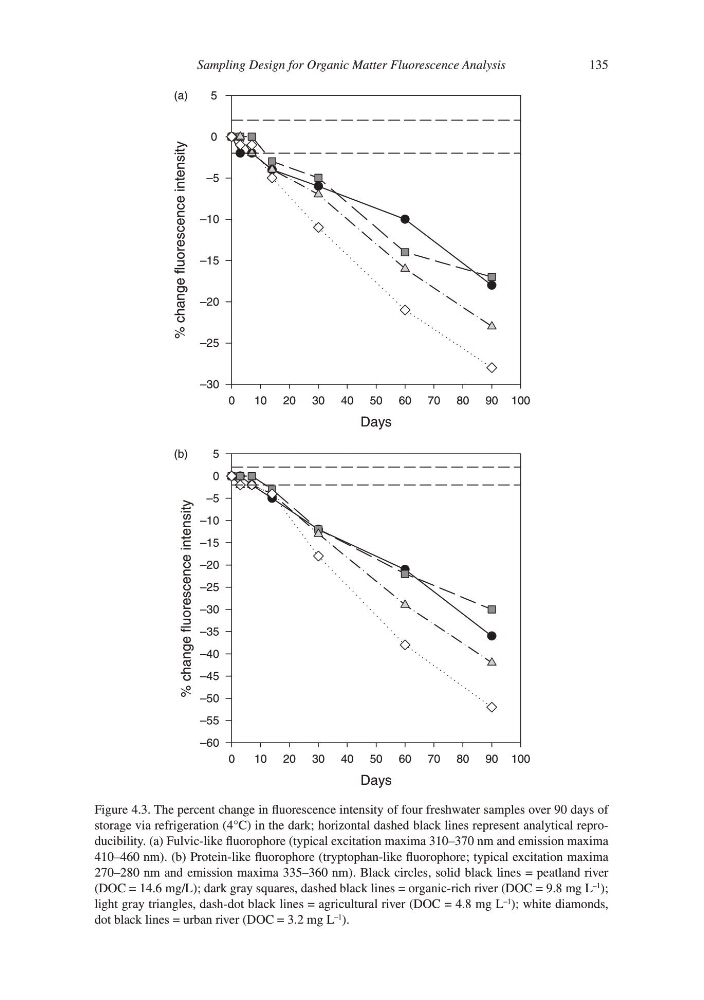
Figure 4.3. The percent change in fluorescence intensity of four freshwater samples over 90 days of
storage via refrigeration (4°C) in the dark; horizontal dashed black lines represent analytical reproducibility. (a) Fulvic-like fluorophore (typical excitation maxima 310–370 nm and emission maxima
410–460 nm). (b) Protein-like fluorophore (tryptophan-like fluorophore; typical excitation maxima
270–280 nm and emission maxima 335–360 nm). Black circles, solid black lines = peatland river
(DOC = 14.6 mg/L); dark gray squares, dashed black lines = organic-rich river (DOC = 9.8 mg L
–1
);
light gray triangles, dash-dot black lines = agricultural river (DOC = 4.8 mg L
–1
); white diamonds,
dot black lines = urban river (DOC = 3.2 mg L
–1
).
135
Days
0
10 20 30 40 50 60 70 80 90 100
Days
0
10 20 30 40 50 60 70 80 90 100
% change fluorescence intensity
–30
–25
–20
–15
–10
–5
0
5
(a)
(b)
% change fluorescence intensity
–60
–55
–50
–45
–40
–35
–30
–25
–20
–15
–10
–5
0
5
Figure 4.3. The percent change in fluorescence intensity of four freshwater samples over 90 days of
storage via refrigeration (4°C) in the dark; horizontal dashed black lines represent analytical reproducibility. (a) Fulvic-like fluorophore (typical excitation maxima 310–370 nm and emission maxima
410–460 nm). (b) Protein-like fluorophore (tryptophan-like fluorophore; typical excitation maxima
270–280 nm and emission maxima 335–360 nm). Black circles, solid black lines = peatland river
(DOC = 14.6 mg/L); dark gray squares, dashed black lines = organic-rich river (DOC = 9.8 mg L
–1
);
light gray triangles, dash-dot black lines = agricultural river (DOC = 4.8 mg L
–1
); white diamonds,
dot black lines = urban river (DOC = 3.2 mg L
–1
).