

Spencer and Coble
132
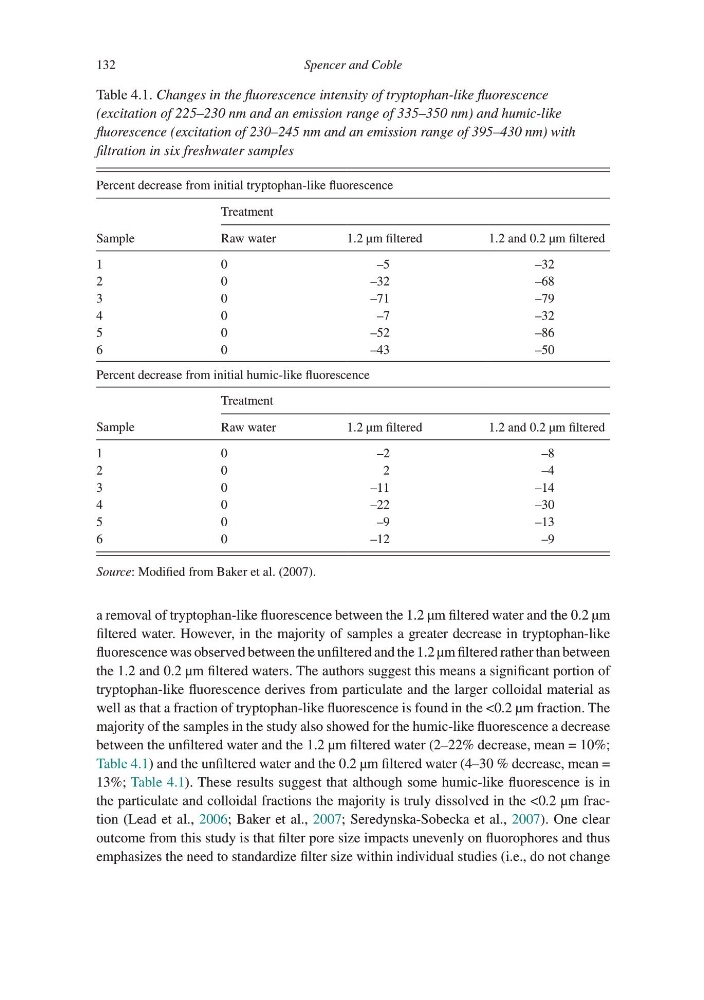
a removal of tryptophan-like fluorescence between the 1.2 µm filtered water and the 0.2 µm
filtered water. However, in the majority of samples a greater decrease in tryptophan-like
fluorescence was observed between the unfiltered and the 1.2 µm filtered rather than between
the 1.2 and 0.2 µm filtered waters. The authors suggest this means a significant portion of
tryptophan-like fluorescence derives from particulate and the larger colloidal material as
well as that a fraction of tryptophan-like fluorescence is found in the <0.2 µm fraction. The
majority of the samples in the study also showed for the humic-like fluorescence a decrease
between the unfiltered water and the 1.2 µm filtered water (2–22% decrease, mean = 10%;
Table 4.1) and the unfiltered water and the 0.2 µm filtered water (4–30 % decrease, mean =
13%; Table 4.1). These results suggest that although some humic-like fluorescence is in
the particulate and colloidal fractions the majority is truly dissolved in the <0.2 µm fraction (Lead et al., 2006; Baker et al., 2007; Seredynska-Sobecka et al., 2007). One clear
outcome from this study is that filter pore size impacts unevenly on fluorophores and thus
emphasizes the need to standardize filter size within individual studies (i.e., do not change
Table 4.1. Changes in the fluorescence intensity of tryptophan-like fluorescence
(excitation of 225–230 nm and an emission range of 335–350 nm) and humic-like
fluorescence (excitation of 230–245 nm and an emission range of 395–430 nm) with
filtration in six freshwater samples
Percent decrease from initial tryptophan-like fluorescence
Treatment
Sample
Raw water
1.2 µm filtered
1.2 and 0.2 µm filtered
1
0
–5
–32
2
0
–32
–68
3
0
–71
–79
4
0
–7
–32
5
0
–52
–86
6
0
–43
–50
Percent decrease from initial humic-like fluorescence
Treatment
Sample
Raw water
1.2 µm filtered
1.2 and 0.2 µm filtered
1
0
–2
–8
2
0
2
–4
3
0
–11
–14
4
0
–22
–30
5
0
–9
–13
6
0
–12
–9
Source: Modified from Baker et al. (2007).
132
a removal of tryptophan-like fluorescence between the 1.2 µm filtered water and the 0.2 µm
filtered water. However, in the majority of samples a greater decrease in tryptophan-like
fluorescence was observed between the unfiltered and the 1.2 µm filtered rather than between
the 1.2 and 0.2 µm filtered waters. The authors suggest this means a significant portion of
tryptophan-like fluorescence derives from particulate and the larger colloidal material as
well as that a fraction of tryptophan-like fluorescence is found in the <0.2 µm fraction. The
majority of the samples in the study also showed for the humic-like fluorescence a decrease
between the unfiltered water and the 1.2 µm filtered water (2–22% decrease, mean = 10%;
Table 4.1) and the unfiltered water and the 0.2 µm filtered water (4–30 % decrease, mean =
13%; Table 4.1). These results suggest that although some humic-like fluorescence is in
the particulate and colloidal fractions the majority is truly dissolved in the <0.2 µm fraction (Lead et al., 2006; Baker et al., 2007; Seredynska-Sobecka et al., 2007). One clear
outcome from this study is that filter pore size impacts unevenly on fluorophores and thus
emphasizes the need to standardize filter size within individual studies (i.e., do not change
Table 4.1. Changes in the fluorescence intensity of tryptophan-like fluorescence
(excitation of 225–230 nm and an emission range of 335–350 nm) and humic-like
fluorescence (excitation of 230–245 nm and an emission range of 395–430 nm) with
filtration in six freshwater samples
Percent decrease from initial tryptophan-like fluorescence
Treatment
Sample
Raw water
1.2 µm filtered
1.2 and 0.2 µm filtered
1
0
–5
–32
2
0
–32
–68
3
0
–71
–79
4
0
–7
–32
5
0
–52
–86
6
0
–43
–50
Percent decrease from initial humic-like fluorescence
Treatment
Sample
Raw water
1.2 µm filtered
1.2 and 0.2 µm filtered
1
0
–2
–8
2
0
2
–4
3
0
–11
–14
4
0
–22
–30
5
0
–9
–13
6
0
–12
–9
Source: Modified from Baker et al. (2007).