

Coble, Spencer, Baker, and Reynolds
110
the mean fluorescence intensities observed for recycled water compared to drinking water,
and concluded that fluorescence could be used for detecting cross connection. Bieroza
et al. (2009a, 2009b, 2010) used an EEM technique for the assessment of TOC removal
efficiency. Organic matter characterization of water samples was obtained for 16 UK surface water treatment works, and the fluorescence intensity of peak C was found to be a
sensitive and reliable measure of OM content, providing both spatial and temporal variations (Bieroza et al., 2009a). Variations in EEMs were reported for samples from different
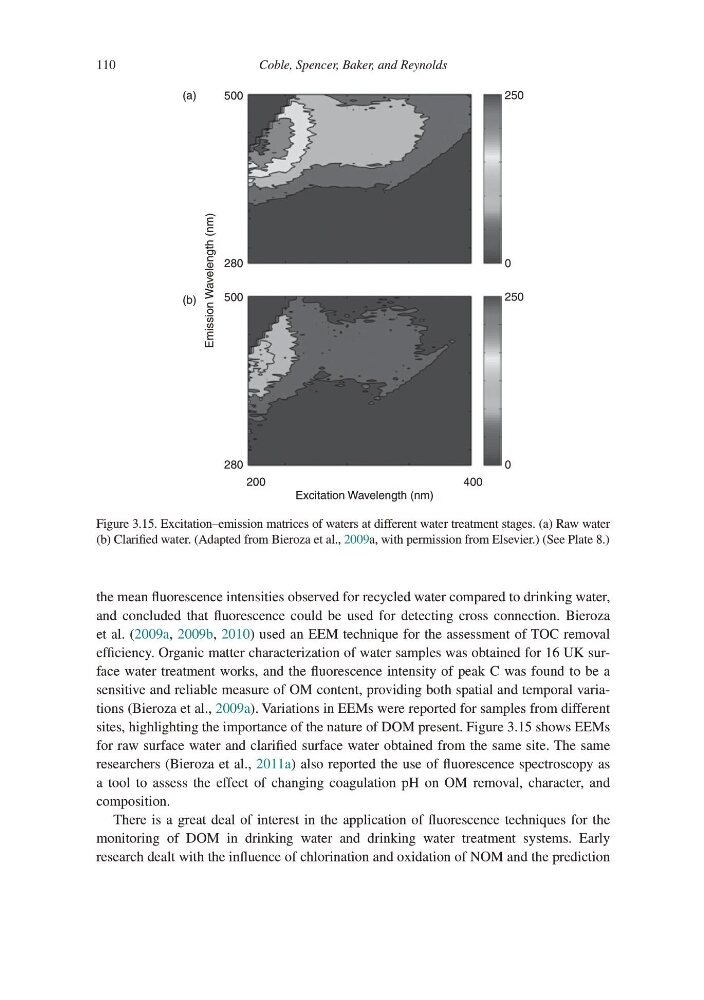
sites, highlighting the importance of the nature of DOM present. Figure 3.15 shows EEMs
for raw surface water and clarified surface water obtained from the same site. The same
researchers (Bieroza et al., 2011a) also reported the use of fluorescence spectroscopy as
a tool to assess the effect of changing coagulation pH on OM removal, character, and
composition.
There is a great deal of interest in the application of fluorescence techniques for the
monitoring of DOM in drinking water and drinking water treatment systems. Early
research dealt with the influence of chlorination and oxidation of NOM and the prediction
280
500
0
250
280
0
500
250
200
400
Excitation Wavelength (nm)
Emission Wavelength (nm)
(a)
(b)
Figure 3.15. Excitation–emission matrices of waters at different water treatment stages. (a) Raw water
(b) Clarified water. (Adapted from Bieroza et al., 2009a, with permission from Elsevier.) (See Plate 8.)
110
the mean fluorescence intensities observed for recycled water compared to drinking water,
and concluded that fluorescence could be used for detecting cross connection. Bieroza
et al. (2009a, 2009b, 2010) used an EEM technique for the assessment of TOC removal
efficiency. Organic matter characterization of water samples was obtained for 16 UK surface water treatment works, and the fluorescence intensity of peak C was found to be a
sensitive and reliable measure of OM content, providing both spatial and temporal variations (Bieroza et al., 2009a). Variations in EEMs were reported for samples from different
sites, highlighting the importance of the nature of DOM present. Figure 3.15 shows EEMs
for raw surface water and clarified surface water obtained from the same site. The same
researchers (Bieroza et al., 2011a) also reported the use of fluorescence spectroscopy as
a tool to assess the effect of changing coagulation pH on OM removal, character, and
composition.
There is a great deal of interest in the application of fluorescence techniques for the
monitoring of DOM in drinking water and drinking water treatment systems. Early
research dealt with the influence of chlorination and oxidation of NOM and the prediction
280
500
0
250
280
0
500
250
200
400
Excitation Wavelength (nm)
Emission Wavelength (nm)
(a)
(b)
Figure 3.15. Excitation–emission matrices of waters at different water treatment stages. (a) Raw water
(b) Clarified water. (Adapted from Bieroza et al., 2009a, with permission from Elsevier.) (See Plate 8.)