

Coble, Spencer, Baker, and Reynolds
104
For SFS, fluorescence intensities can be expressed as I f = ηI a , where η is the quantum
yield at λ ex and I a is the absorbed intensity (Reynolds and Ahmad, 1995b). From Beer’s law,
I a = I 0 {1 – exp(–αcl)}, where I 0 is the incident intensity, α is the absorption cross section
and l is the effective sampling length. For αcl≪l, I f ≈ I 0 ηcl. In SFS the excitation wavelength (λ ex ) and the emission wavelength (λ em ) are scanned synchronously, with a fixed
off-set such that △λ = (λ em – λ ex ). The normalized fluorescence intensity can be represented
by: I f /I 0 = I 0 λ΄ α (λ΄ )cl, where the quantum yield and the absorption cross-section are functions of λ΄ = (λ em – △λ). The intensity distribution will, therefore, show a pronounced peak
when the absorption maximum and the quantum yield maximum overlap. For well defined
200 300 400
∆λ = 60nm
∆λ = 40nm
∆λ = 20nm
Wavelength (nm)
500 600 700
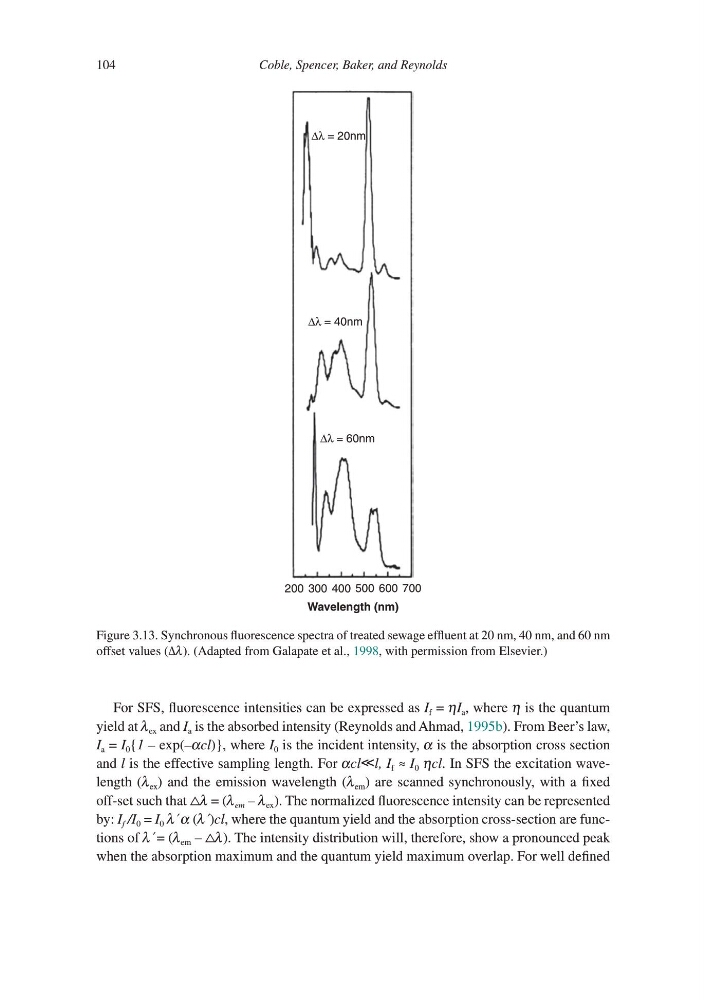
Figure 3.13. Synchronous fluorescence spectra of treated sewage effluent at 20 nm, 40 nm, and 60 nm
offset values (Δλ). (Adapted from Galapate et al., 1998, with permission from Elsevier.)
104
For SFS, fluorescence intensities can be expressed as I f = ηI a , where η is the quantum
yield at λ ex and I a is the absorbed intensity (Reynolds and Ahmad, 1995b). From Beer’s law,
I a = I 0 {1 – exp(–αcl)}, where I 0 is the incident intensity, α is the absorption cross section
and l is the effective sampling length. For αcl≪l, I f ≈ I 0 ηcl. In SFS the excitation wavelength (λ ex ) and the emission wavelength (λ em ) are scanned synchronously, with a fixed
off-set such that △λ = (λ em – λ ex ). The normalized fluorescence intensity can be represented
by: I f /I 0 = I 0 λ΄ α (λ΄ )cl, where the quantum yield and the absorption cross-section are functions of λ΄ = (λ em – △λ). The intensity distribution will, therefore, show a pronounced peak
when the absorption maximum and the quantum yield maximum overlap. For well defined
200 300 400
∆λ = 60nm
∆λ = 40nm
∆λ = 20nm
Wavelength (nm)
500 600 700
Figure 3.13. Synchronous fluorescence spectra of treated sewage effluent at 20 nm, 40 nm, and 60 nm
offset values (Δλ). (Adapted from Galapate et al., 1998, with permission from Elsevier.)