

Aquatic Organic Matter Fluorescence
89
Below the surface mixed layers, CDOM concentrations increase with depth in the
open ocean. This distribution has allowed some investigators to use CDOM as a tracer for
upwelling in open ocean gyres (Hoge and Lyon, 2005) as well as in coastal upwelling areas
(Coble et al., 1998).
Several lines of evidence indicate that CDOM is very stable below the zone of photobleaching. Off the coast of Oman in the Arabian Sea upwelling, there is a strong negative
correlation between CDOM and salinity in surface waters during most of the year due
to photobleaching, but a strong positive correlation between CDOM and salinity in the
subsurface salinity maximum (Coble et al., 1998). After periods of extreme mixing, the
relationship in surface waters is reversed due to input of subsurface waters. More recently,
analysis of CDOM and apparent oxygen utilization (AOU) data in the North Pacific Ocean
has demonstrated a linear relationship between the two properties (Yamashita and Tanoue,
2008). This finding leads to the conclusion that the fluorescent material is produced from
organic matter in the water column but is itself highly resistant (on the order of 100 to
1000 years) to degradation, as it accumulates in direct proportion to oxygen utilization. The
authors estimated the rate of production in the interior of the ocean to be larger than input
1400
1200
1000
800
600
400
200
0 300
500
700
300
350
Eqpac sta. 4 @ 5N 0700 CTD surface EQ041CCS
Eqpac sta. 4 @ 5N noon–CTD surface EQ046PCS
400
450
Excitation (nm)
300
350
400
450
Excitation (nm)
Emission wavelength (nm)
300
500
700
Emission wavelength (nm)
Fluorescene intensity (cps)
1400
1200
1000
800
600
400
200
0
Fluorescene intensity (cps)
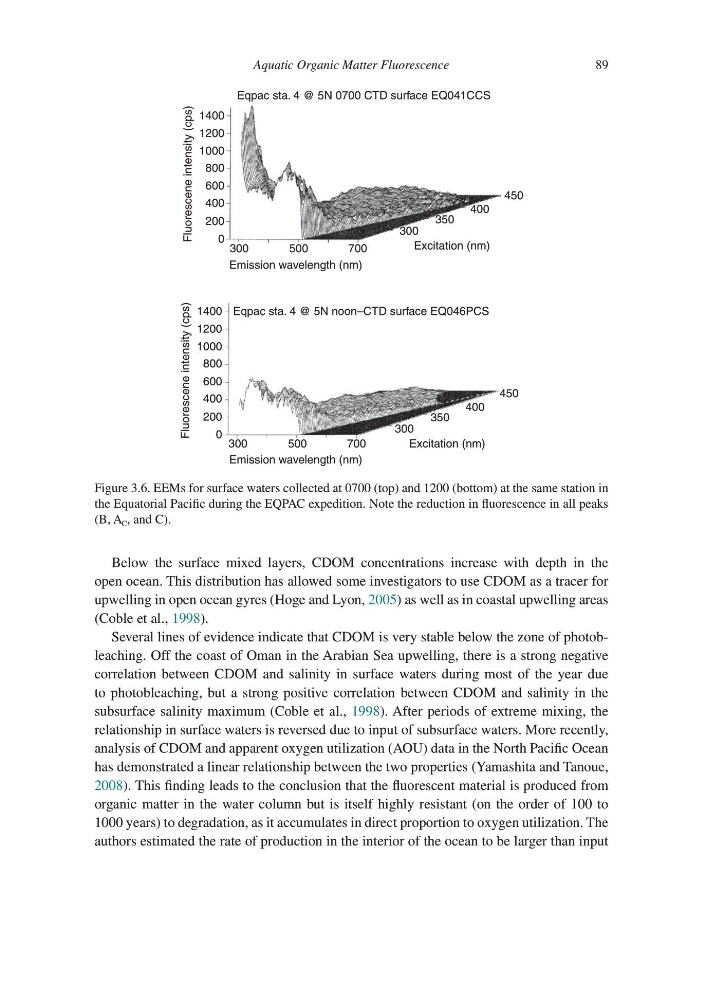
Figure 3.6. EEMs for surface waters collected at 0700 (top) and 1200 (bottom) at the same station in
the Equatorial Pacific during the EQPAC expedition. Note the reduction in fluorescence in all peaks
(B, A C , and C).
89
Below the surface mixed layers, CDOM concentrations increase with depth in the
open ocean. This distribution has allowed some investigators to use CDOM as a tracer for
upwelling in open ocean gyres (Hoge and Lyon, 2005) as well as in coastal upwelling areas
(Coble et al., 1998).
Several lines of evidence indicate that CDOM is very stable below the zone of photobleaching. Off the coast of Oman in the Arabian Sea upwelling, there is a strong negative
correlation between CDOM and salinity in surface waters during most of the year due
to photobleaching, but a strong positive correlation between CDOM and salinity in the
subsurface salinity maximum (Coble et al., 1998). After periods of extreme mixing, the
relationship in surface waters is reversed due to input of subsurface waters. More recently,
analysis of CDOM and apparent oxygen utilization (AOU) data in the North Pacific Ocean
has demonstrated a linear relationship between the two properties (Yamashita and Tanoue,
2008). This finding leads to the conclusion that the fluorescent material is produced from
organic matter in the water column but is itself highly resistant (on the order of 100 to
1000 years) to degradation, as it accumulates in direct proportion to oxygen utilization. The
authors estimated the rate of production in the interior of the ocean to be larger than input
1400
1200
1000
800
600
400
200
0 300
500
700
300
350
Eqpac sta. 4 @ 5N 0700 CTD surface EQ041CCS
Eqpac sta. 4 @ 5N noon–CTD surface EQ046PCS
400
450
Excitation (nm)
300
350
400
450
Excitation (nm)
Emission wavelength (nm)
300
500
700
Emission wavelength (nm)
Fluorescene intensity (cps)
1400
1200
1000
800
600
400
200
0
Fluorescene intensity (cps)
Figure 3.6. EEMs for surface waters collected at 0700 (top) and 1200 (bottom) at the same station in
the Equatorial Pacific during the EQPAC expedition. Note the reduction in fluorescence in all peaks
(B, A C , and C).