

The structure of bacteriorhodopsin became a staging ground by Richard
Henderson and coworkers for the development of new technical approaches
to overcome these difficulties. To avoid radiation damage the intensity of
the beam was decreased by limiting the focusing and the samples were
measured at low temperature. A significant improvement in the resolution was achieved by not depending upon the real images that have a
limited resolution but by measuring the diffraction of electrons from the
two-dimensional crystal. Unlike protein crystallography, the phase is not
a problem. The electron density can be determined from the images and
hence the phases for the diffraction data can be found immediately (see
Chapter 15).
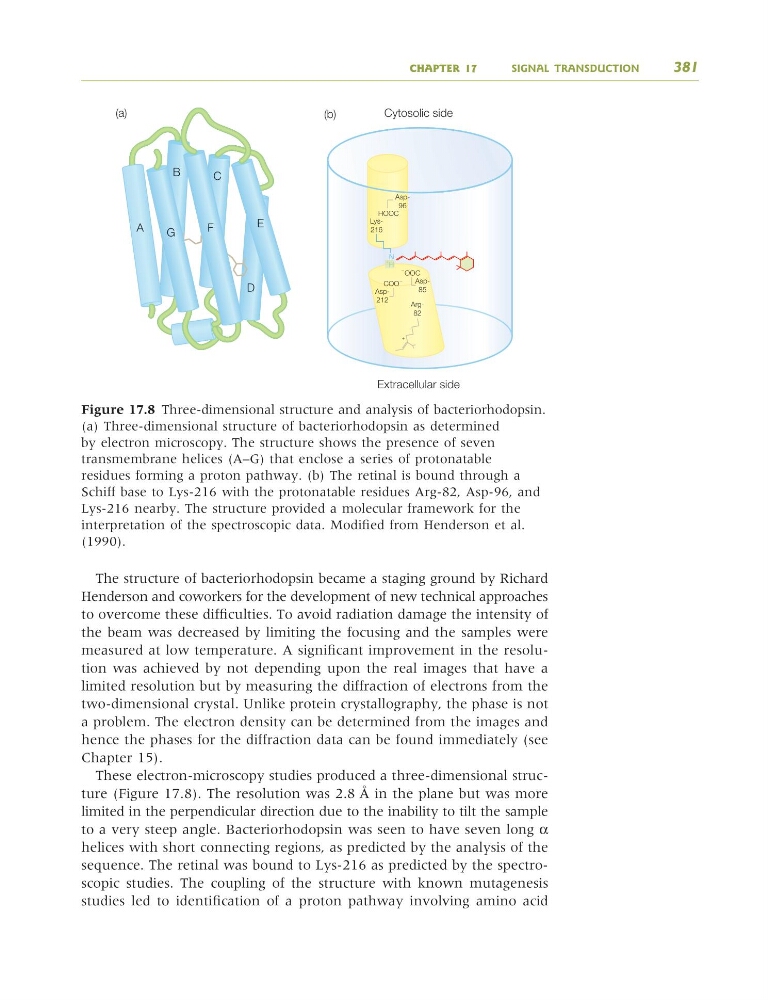
These electron-microscopy studies produced a three-dimensional structure (Figure 17.8). The resolution was 2.8 Å in the plane but was more
limited in the perpendicular direction due to the inability to tilt the sample
to a very steep angle. Bacteriorhodopsin was seen to have seven long α
helices with short connecting regions, as predicted by the analysis of the
sequence. The retinal was bound to Lys-216 as predicted by the spectroscopic studies. The coupling of the structure with known mutagenesis
studies led to identification of a proton pathway involving amino acid
CHAPTER 17
SIGNAL TRANSDUCTION
381
(a)
B
C
E
D
A
F
G
N
Lys216
Asp96
Asp212
Asp85
Ϫ
OOC
COO
Ϫ
HOOC
Cytosolic side
Extracellular side
Arg82
ϩ
ϩ
H
(b)
Figure 17.8 Three-dimensional structure and analysis of bacteriorhodopsin.
(a) Three-dimensional structure of bacteriorhodopsin as determined
by electron microscopy. The structure shows the presence of seven
transmembrane helices (A–G) that enclose a series of protonatable
residues forming a proton pathway. (b) The retinal is bound through a
Schiff base to Lys-216 with the protonatable residues Arg-82, Asp-96, and
Lys-216 nearby. The structure provided a molecular framework for the
interpretation of the spectroscopic data. Modified from Henderson et al.
(1990).
9781405124362_4_017.qxd 4/29/08 10:46 Page 381
Henderson and coworkers for the development of new technical approaches
to overcome these difficulties. To avoid radiation damage the intensity of
the beam was decreased by limiting the focusing and the samples were
measured at low temperature. A significant improvement in the resolution was achieved by not depending upon the real images that have a
limited resolution but by measuring the diffraction of electrons from the
two-dimensional crystal. Unlike protein crystallography, the phase is not
a problem. The electron density can be determined from the images and
hence the phases for the diffraction data can be found immediately (see
Chapter 15).
These electron-microscopy studies produced a three-dimensional structure (Figure 17.8). The resolution was 2.8 Å in the plane but was more
limited in the perpendicular direction due to the inability to tilt the sample
to a very steep angle. Bacteriorhodopsin was seen to have seven long α
helices with short connecting regions, as predicted by the analysis of the
sequence. The retinal was bound to Lys-216 as predicted by the spectroscopic studies. The coupling of the structure with known mutagenesis
studies led to identification of a proton pathway involving amino acid
CHAPTER 17
SIGNAL TRANSDUCTION
381
(a)
B
C
E
D
A
F
G
N
Lys216
Asp96
Asp212
Asp85
Ϫ
OOC
COO
Ϫ
HOOC
Cytosolic side
Extracellular side
Arg82
ϩ
ϩ
H
(b)
Figure 17.8 Three-dimensional structure and analysis of bacteriorhodopsin.
(a) Three-dimensional structure of bacteriorhodopsin as determined
by electron microscopy. The structure shows the presence of seven
transmembrane helices (A–G) that enclose a series of protonatable
residues forming a proton pathway. (b) The retinal is bound through a
Schiff base to Lys-216 with the protonatable residues Arg-82, Asp-96, and
Lys-216 nearby. The structure provided a molecular framework for the
interpretation of the spectroscopic data. Modified from Henderson et al.
(1990).
9781405124362_4_017.qxd 4/29/08 10:46 Page 381