

Just as for the nuclear spins, the electronic spins will split the atomic energy
levels in the presence of an external magnetic field, B (Figure 16.1):
E = −μ z B = g e μ B m s B
(16.14)
Note that because the electrons and protons have opposite charges, the
lower-energy state for this case is the −1/2 spin.
Transitions will occur when the energy of the applied light is equal to
this energy difference, giving:
ΔE = g e μ B B = hν
(16.15)
This resonance frequency is substantially different than that used for the
NMR, primarily due to the difference in the dipole moments (eqn 16.14).
Using typical values of ν NMR = 100 MHz, B NMR = 10 T, and B EPR = 0.3 T gives:
(16.16)
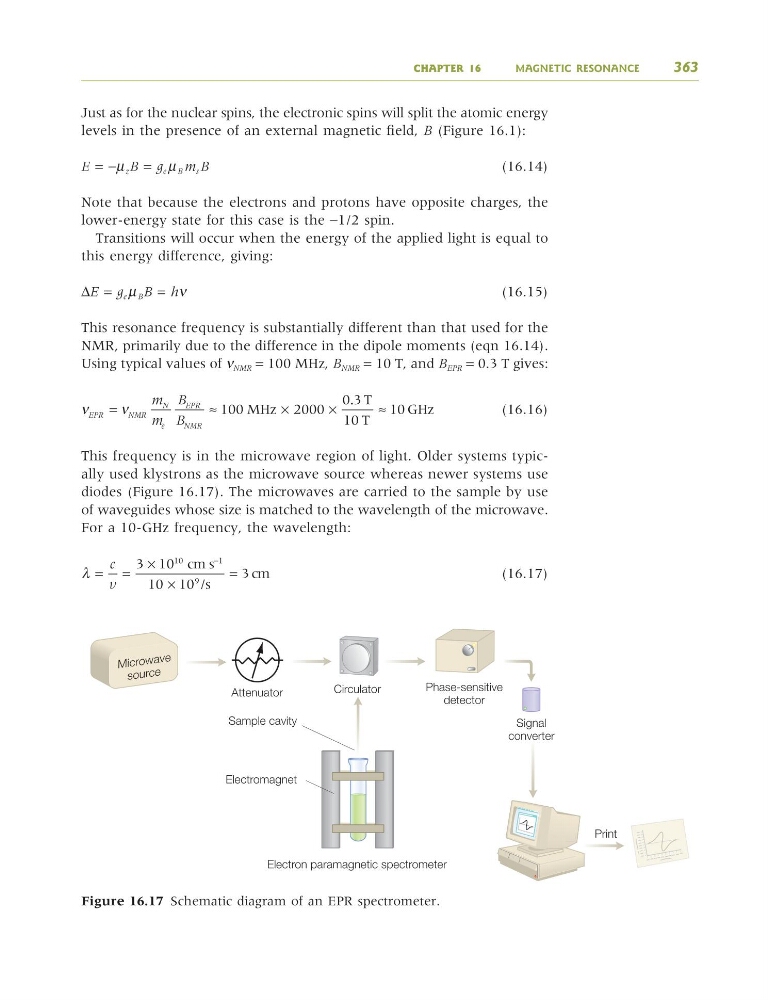
This frequency is in the microwave region of light. Older systems typically used klystrons as the microwave source whereas newer systems use
diodes (Figure 16.17). The microwaves are carried to the sample by use
of waveguides whose size is matched to the wavelength of the microwave.
For a 10-GHz frequency, the wavelength:
(16.17)
λ = =
×
×
=
−
c
9
3 10
10 10
3
10
1
9
cm s
/s
cm
ν
ν
EPR
NMR
N
e
EPR
NMR
m
m
B
B
=
≈
×
×
100
2000
0
MHz
. .3
10
10
T
T
GHz
≈
CHAPTER 16
MAGNETIC RESONANCE
363
Phase-sensitive
detector
Signal
converter
Circulator
Print
Mi cro wa ve
so urc e
Electromagnet
Electron paramagnetic spectrometer
Sample cavity
Attenuator
Figure 16.17 Schematic diagram of an EPR spectrometer.
9781405124362_4_016.qxd 4/29/08 10:45 Page 363
levels in the presence of an external magnetic field, B (Figure 16.1):
E = −μ z B = g e μ B m s B
(16.14)
Note that because the electrons and protons have opposite charges, the
lower-energy state for this case is the −1/2 spin.
Transitions will occur when the energy of the applied light is equal to
this energy difference, giving:
ΔE = g e μ B B = hν
(16.15)
This resonance frequency is substantially different than that used for the
NMR, primarily due to the difference in the dipole moments (eqn 16.14).
Using typical values of ν NMR = 100 MHz, B NMR = 10 T, and B EPR = 0.3 T gives:
(16.16)
This frequency is in the microwave region of light. Older systems typically used klystrons as the microwave source whereas newer systems use
diodes (Figure 16.17). The microwaves are carried to the sample by use
of waveguides whose size is matched to the wavelength of the microwave.
For a 10-GHz frequency, the wavelength:
(16.17)
λ = =
×
×
=
−
c
9
3 10
10 10
3
10
1
9
cm s
/s
cm
ν
ν
EPR
NMR
N
e
EPR
NMR
m
m
B
B
=
≈
×
×
100
2000
0
MHz
. .3
10
10
T
T
GHz
≈
CHAPTER 16
MAGNETIC RESONANCE
363
Phase-sensitive
detector
Signal
converter
Circulator
Mi cro wa ve
so urc e
Electromagnet
Electron paramagnetic spectrometer
Sample cavity
Attenuator
Figure 16.17 Schematic diagram of an EPR spectrometer.
9781405124362_4_016.qxd 4/29/08 10:45 Page 363