

66
M. Callisto et al.
is approximately 700 mm/year. In all the reservoirs, the dry
periods occurred between August and March. These periods
included low precipitation levels (40–280 mm), and the hydrometric levels of the reservoirs were generally low as well.
During the rainy seasons, from May to July, the precipitation was higher (150–450 mm) and the reservoirs reached
their maximum capacity. The wind velocity in the region was
typically negligible and ranged from 3 to 4 m s
−1
. The total
annual evaporation varied between 2,500 and 3,000 mm with
decreasing values trending from west to east.
Each of the 20 reservoirs was sampled eight times between August 2006 and August 2009, including sampling
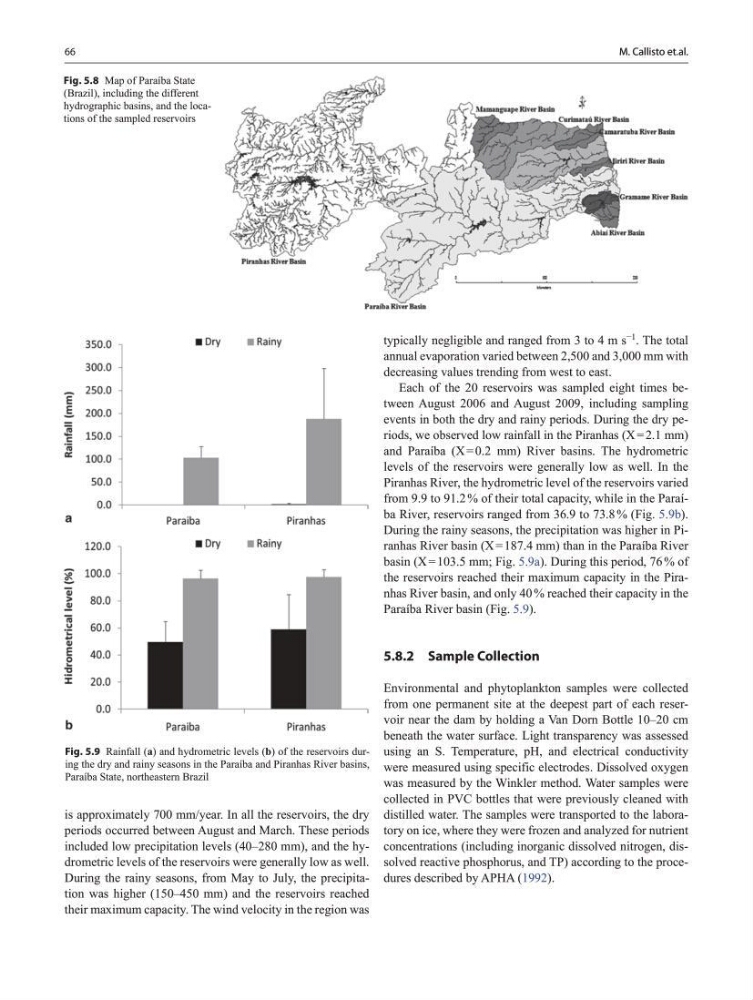
events in both the dry and rainy periods. During the dry periods, we observed low rainfall in the Piranhas (X = 2.1 mm)
and Paraíba (X = 0.2 mm) River basins. The hydrometric
levels of the reservoirs were generally low as well. In the
Piranhas River, the hydrometric level of the reservoirs varied
from 9.9 to 91.2 % of their total capacity, while in the Paraíba River, reservoirs ranged from 36.9 to 73.8 % (Fig. 5.9b).
During the rainy seasons, the precipitation was higher in Piranhas River basin (X = 187.4 mm) than in the Paraíba River
basin (X = 103.5 mm; Fig. 5.9a). During this period, 76 % of
the reservoirs reached their maximum capacity in the Piranhas River basin, and only 40 % reached their capacity in the
Paraíba River basin (Fig. 5.9).
5.8.2 Sample Collection
Environmental and phytoplankton samples were collected
from one permanent site at the deepest part of each reservoir near the dam by holding a Van Dorn Bottle 10–20 cm
beneath the water surface. Light transparency was assessed
using an S. Temperature, pH, and electrical conductivity
were measured using specific electrodes. Dissolved oxygen
was measured by the Winkler method. Water samples were
collected in PVC bottles that were previously cleaned with
distilled water. The samples were transported to the laboratory on ice, where they were frozen and analyzed for nutrient
concentrations (including inorganic dissolved nitrogen, dissolved reactive phosphorus, and TP) according to the procedures described by APHA (1992).
Fig. 5.8 Map of Paraíba State
(Brazil), including the different
hydrographic basins, and the locations of the sampled reservoirs
Fig. 5.9 Rainfall (a) and hydrometric levels (b) of the reservoirs during the dry and rainy seasons in the Paraíba and Piranhas River basins,
Paraíba State, northeastern Brazil
M. Callisto et.al.
M. Callisto et al.
is approximately 700 mm/year. In all the reservoirs, the dry
periods occurred between August and March. These periods
included low precipitation levels (40–280 mm), and the hydrometric levels of the reservoirs were generally low as well.
During the rainy seasons, from May to July, the precipitation was higher (150–450 mm) and the reservoirs reached
their maximum capacity. The wind velocity in the region was
typically negligible and ranged from 3 to 4 m s
−1
. The total
annual evaporation varied between 2,500 and 3,000 mm with
decreasing values trending from west to east.
Each of the 20 reservoirs was sampled eight times between August 2006 and August 2009, including sampling
events in both the dry and rainy periods. During the dry periods, we observed low rainfall in the Piranhas (X = 2.1 mm)
and Paraíba (X = 0.2 mm) River basins. The hydrometric
levels of the reservoirs were generally low as well. In the
Piranhas River, the hydrometric level of the reservoirs varied
from 9.9 to 91.2 % of their total capacity, while in the Paraíba River, reservoirs ranged from 36.9 to 73.8 % (Fig. 5.9b).
During the rainy seasons, the precipitation was higher in Piranhas River basin (X = 187.4 mm) than in the Paraíba River
basin (X = 103.5 mm; Fig. 5.9a). During this period, 76 % of
the reservoirs reached their maximum capacity in the Piranhas River basin, and only 40 % reached their capacity in the
Paraíba River basin (Fig. 5.9).
5.8.2 Sample Collection
Environmental and phytoplankton samples were collected
from one permanent site at the deepest part of each reservoir near the dam by holding a Van Dorn Bottle 10–20 cm
beneath the water surface. Light transparency was assessed
using an S. Temperature, pH, and electrical conductivity
were measured using specific electrodes. Dissolved oxygen
was measured by the Winkler method. Water samples were
collected in PVC bottles that were previously cleaned with
distilled water. The samples were transported to the laboratory on ice, where they were frozen and analyzed for nutrient
concentrations (including inorganic dissolved nitrogen, dissolved reactive phosphorus, and TP) according to the procedures described by APHA (1992).
Fig. 5.8 Map of Paraíba State
(Brazil), including the different
hydrographic basins, and the locations of the sampled reservoirs
Fig. 5.9 Rainfall (a) and hydrometric levels (b) of the reservoirs during the dry and rainy seasons in the Paraíba and Piranhas River basins,
Paraíba State, northeastern Brazil
M. Callisto et.al.