

10 Seasonal and Spatial Nutrient Dynamics in Saronikos Gulf: The Impact of Sewage Effluents …
117
(secondary-tertiary treatment) when a significant decline
in Ulva spp. was observed (Tsiamis et al. 2012). After
1994, soft bottom macroinvertebrate communities, living at 70–90 m depth, showed deterioration very close to
the outfall and an improvement with the distance from the
discharge point. Elimination of organic load after 2004 by
the secondary treatment resulted in the amelioration of the
entire area planktonic and benthic communities (SiokouFrangou et al. 2009). Additionally, the spatial variability of
nutrients and particulate organic carbon seems to affect the
ecological statusof the inner Saronikos Gulf. According to
the classification suggested by the EU Water Framework
Directive (2000), ecological quality of the inner Saronikos
Gulf of both phytobenthic and macrozoobenthic communities improves with increasing distance from the sewage outfall (Siokou-Frangou et al. 2009) that can vary from poor
at station S7 (Bentix index 2.20; Simboura et al. 2005) to
moderate at station S8 (Bentix index 2.71) and good at stations S13, S11, and S16 (Simboura et al. 2005; Zenetos et al.
2005; Simboura and Zenetos 2002). The poor trophic status
corresponds with the higher mesotrophic conditions indicating “sensitive” ecosystems and leading to eutrophic conditions in future. The good status corresponds with the lower
mesotrophic level characterizing nonsensitive areas (Pagou
et al. 2002; Simboura et al. 2005).
10.3.3 Observations on Hydrography
The circulation in Saronikos Gulf has been described (Kontoyiannis 2010) based on direct current measurements
on a seasonal basis and under various wind conditions. It
was shown that the circulation of the Saronikos Gulf has a
distinct two-layer structure in the period from late spring to
summer to late fall, whereas it is barotropic during the rest of
the year (December–March). Observations in the Inner Gulf
showed that the different wind directions found related to the
different circulation patterns of Saronikos Gulf. In summer
an anticyclonic and a cyclonic flow exists throughout the
Gulf above and below the pycnocline, respectively, whereas,
in winter and early spring an anticyclonic flow prevails in
the upper ~ 100 m. In late spring-early summer cyclonic and
anticyclonic flow occurs in the upper (~ 0–40 m) and deeper
(~ 60–100 m) layers, respectively (Fig. 10.5). Throughout
the year, the spreading of the plume was governed by advection caused by the prevailing circulation pattern at the
particular layer where the plume floats.
The profiles (Fig. 10.3) show typical seasonal variations
of dissolved oxygen, chlorophyll, salinity, density, and turbidity expressed as beam attenuation coefficient (B.A.C.)
at station S7. The higher values of beam attenuation coefficient are indicative of lower water transparencies. In the
presence of a well-developed thermocline, the treated plume
was trapped in the pycnocline at S7, shown by the lower
transparency and lower salinity values near ~ 50 m. Generally, in the inner Saronikos Gulf, lower salinity values were
observed in the deeper layers owing to the influence of Aegean water coming into the inner Gulf from the south open
boundary. During the winter mixing period, the plume ascends to the sea surface, occupying a surface layer approximately 20–30 m thick.
Period
Layers
PO 4
3− (μM)
SiO 4
2− (μM)
NO 2
− (μM)
NO 3
− (μM)
NH 4
+ (μM)
N:P
Before
treatment
(1987–1994)
0–20 m
0.42 ± 0.95
1.01 ± 0.38
0.25 ± 0.23
0.68 ± 0.36
0.90 ± 0.96
8.14 ± 3.83
30–60 m
0.15 ± 0.08
1.18 ± 0.41
0.32 ± 0.23
0.53 ± 0.33
0.44 ± 0.38
9.46 ± 4.35
Water column 0.24 ± 0.29
1.23 ± 0.44
0.25 ± 0.21
0.61 ± 0.31
0.76 ± 0.56
8.66 ± 3.95
During primary
treatment
(1995–2004)
0–20 m
0.29 ± 0.25
1.58 ± 0.84
0.23 ± 0.23
0.72 ± 0.49
1.04 ± 1.58
10.6 ± 12.9
30–60 m
0.56 ± 0.54
1.89 ± 0.80
0.31 ± 0.20
0.73 ± 0.88
1.81 ± 2.90
7.25 ± 6.64
Water column 0.39 ± 0.23
1.95 ± 0.69
0.30 ± 0.19
0.87 ± 0.51
1.33 ± 1.37
2.37 ± 1.44
During secondary treatment
(2005–2010)
0–20 m
0.15 ± 0.11
1.57 ± 0.64
0.12 ± 0.13
0.34 ± 0.33
0.51 ± 0.55
10.8 ± 14.7
30–60 m
0.28 ± 0.34
1.81 ± 0.93
0.24 ± 0.22
0.81 ± 1.03
1.82 ± 3.89
9.50 ± 7.00
Water column 0.20 ± 0.13
1.74 ± 0.66
0.21 ± 0.23
0.58 ± 0.42
1.00 ± 1.46
13.1 ± 11.7
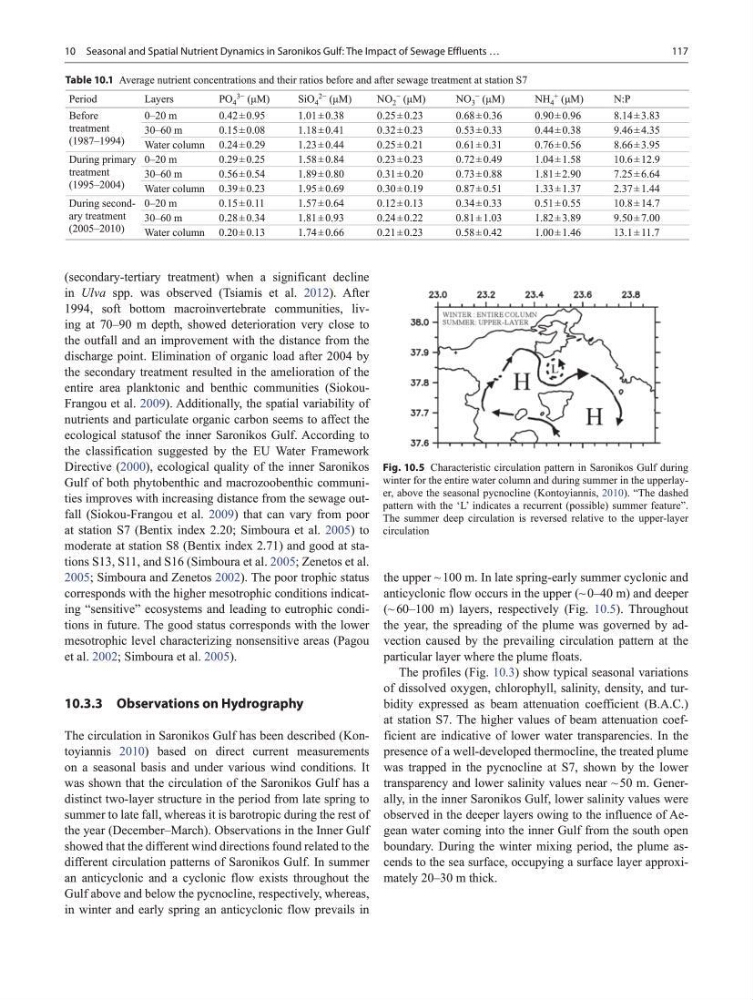
Table 10.1 Average nutrient concentrations and their ratios before and after sewage treatment at station S7
Fig. 10.5 Characteristic circulation pattern in Saronikos Gulf during
winter for the entire water column and during summer in the upperlayer, above the seasonal pycnocline (Kontoyiannis, 2010). “The dashed
pattern with the ‘L’ indicates a recurrent (possible) summer feature”.
The summer deep circulation is reversed relative to the upper-layer
circulation
117
(secondary-tertiary treatment) when a significant decline
in Ulva spp. was observed (Tsiamis et al. 2012). After
1994, soft bottom macroinvertebrate communities, living at 70–90 m depth, showed deterioration very close to
the outfall and an improvement with the distance from the
discharge point. Elimination of organic load after 2004 by
the secondary treatment resulted in the amelioration of the
entire area planktonic and benthic communities (SiokouFrangou et al. 2009). Additionally, the spatial variability of
nutrients and particulate organic carbon seems to affect the
ecological statusof the inner Saronikos Gulf. According to
the classification suggested by the EU Water Framework
Directive (2000), ecological quality of the inner Saronikos
Gulf of both phytobenthic and macrozoobenthic communities improves with increasing distance from the sewage outfall (Siokou-Frangou et al. 2009) that can vary from poor
at station S7 (Bentix index 2.20; Simboura et al. 2005) to
moderate at station S8 (Bentix index 2.71) and good at stations S13, S11, and S16 (Simboura et al. 2005; Zenetos et al.
2005; Simboura and Zenetos 2002). The poor trophic status
corresponds with the higher mesotrophic conditions indicating “sensitive” ecosystems and leading to eutrophic conditions in future. The good status corresponds with the lower
mesotrophic level characterizing nonsensitive areas (Pagou
et al. 2002; Simboura et al. 2005).
10.3.3 Observations on Hydrography
The circulation in Saronikos Gulf has been described (Kontoyiannis 2010) based on direct current measurements
on a seasonal basis and under various wind conditions. It
was shown that the circulation of the Saronikos Gulf has a
distinct two-layer structure in the period from late spring to
summer to late fall, whereas it is barotropic during the rest of
the year (December–March). Observations in the Inner Gulf
showed that the different wind directions found related to the
different circulation patterns of Saronikos Gulf. In summer
an anticyclonic and a cyclonic flow exists throughout the
Gulf above and below the pycnocline, respectively, whereas,
in winter and early spring an anticyclonic flow prevails in
the upper ~ 100 m. In late spring-early summer cyclonic and
anticyclonic flow occurs in the upper (~ 0–40 m) and deeper
(~ 60–100 m) layers, respectively (Fig. 10.5). Throughout
the year, the spreading of the plume was governed by advection caused by the prevailing circulation pattern at the
particular layer where the plume floats.
The profiles (Fig. 10.3) show typical seasonal variations
of dissolved oxygen, chlorophyll, salinity, density, and turbidity expressed as beam attenuation coefficient (B.A.C.)
at station S7. The higher values of beam attenuation coefficient are indicative of lower water transparencies. In the
presence of a well-developed thermocline, the treated plume
was trapped in the pycnocline at S7, shown by the lower
transparency and lower salinity values near ~ 50 m. Generally, in the inner Saronikos Gulf, lower salinity values were
observed in the deeper layers owing to the influence of Aegean water coming into the inner Gulf from the south open
boundary. During the winter mixing period, the plume ascends to the sea surface, occupying a surface layer approximately 20–30 m thick.
Period
Layers
PO 4
3− (μM)
SiO 4
2− (μM)
NO 2
− (μM)
NO 3
− (μM)
NH 4
+ (μM)
N:P
Before
treatment
(1987–1994)
0–20 m
0.42 ± 0.95
1.01 ± 0.38
0.25 ± 0.23
0.68 ± 0.36
0.90 ± 0.96
8.14 ± 3.83
30–60 m
0.15 ± 0.08
1.18 ± 0.41
0.32 ± 0.23
0.53 ± 0.33
0.44 ± 0.38
9.46 ± 4.35
Water column 0.24 ± 0.29
1.23 ± 0.44
0.25 ± 0.21
0.61 ± 0.31
0.76 ± 0.56
8.66 ± 3.95
During primary
treatment
(1995–2004)
0–20 m
0.29 ± 0.25
1.58 ± 0.84
0.23 ± 0.23
0.72 ± 0.49
1.04 ± 1.58
10.6 ± 12.9
30–60 m
0.56 ± 0.54
1.89 ± 0.80
0.31 ± 0.20
0.73 ± 0.88
1.81 ± 2.90
7.25 ± 6.64
Water column 0.39 ± 0.23
1.95 ± 0.69
0.30 ± 0.19
0.87 ± 0.51
1.33 ± 1.37
2.37 ± 1.44
During secondary treatment
(2005–2010)
0–20 m
0.15 ± 0.11
1.57 ± 0.64
0.12 ± 0.13
0.34 ± 0.33
0.51 ± 0.55
10.8 ± 14.7
30–60 m
0.28 ± 0.34
1.81 ± 0.93
0.24 ± 0.22
0.81 ± 1.03
1.82 ± 3.89
9.50 ± 7.00
Water column 0.20 ± 0.13
1.74 ± 0.66
0.21 ± 0.23
0.58 ± 0.42
1.00 ± 1.46
13.1 ± 11.7
Table 10.1 Average nutrient concentrations and their ratios before and after sewage treatment at station S7
Fig. 10.5 Characteristic circulation pattern in Saronikos Gulf during
winter for the entire water column and during summer in the upperlayer, above the seasonal pycnocline (Kontoyiannis, 2010). “The dashed
pattern with the ‘L’ indicates a recurrent (possible) summer feature”.
The summer deep circulation is reversed relative to the upper-layer
circulation