

50
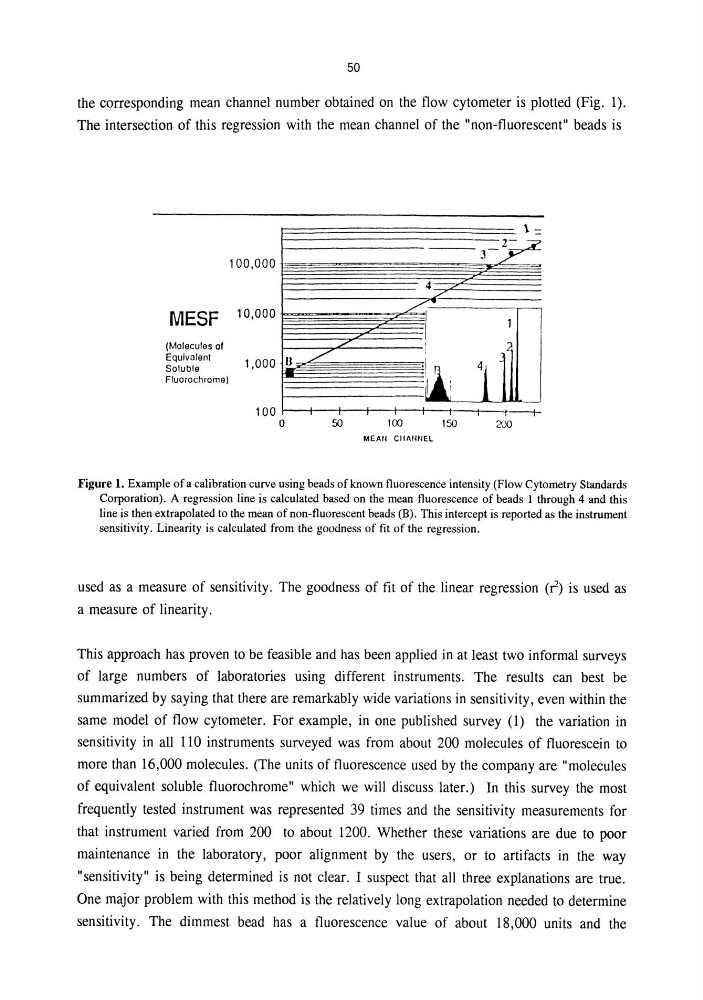
the corresponding mean channel number obtained on the flow cytometer is plotted (Fig. 1).
The intersection of this regression with the mean channel of the "non-fluorescent" beads is
MESF
(Molecules of
Equivalent
Soluble
Fluorochrome)
100,000
10,000
1,000
100
. /
1.I /
o
50
\=
3?
4 / '
~.
1
J
I
I
.L
'!Il:
1
---t100
150
MEAN CHAIUIEL
Figure 1. Example of a calibration curve using beads of known fluorescence intensity (Flow Cytometry Standards
Corporation). A regression line is calculated based on the mean fluorescence of beads 1 through 4 and this
line is then extrapolated to the mean of non-fluorescent beads (B). This intercept is reported as the instrument
sensitivity. Linearity is calculated from the goodness of fit of the regression.
used as a measure of sensitivity. The goodness of fit of the linear regression (r) is used as
a measure of linearity.
This approach has proven to be feasible and has been applied in at least two informal surveys
of large numbers of laboratories using different instruments. The results can best be
summarized by saying that there are remarkably wide variations in sensitivity, even within the
same model of flow cytometer. For example, in one published survey (1) the variation in
sensitivity in all 110 instruments surveyed was from about 200 molecules of fluorescein to
more than 16,000 molecules. (The units of fluorescence used by the company are "molecules
of equivalent soluble fluorochrome" which we will discuss later.) In this survey the most
frequently tested instrument was represented 39 times and the sensitivity measurements for
that instrument varied from 200 to about 1200. Whether these variations are due to poor
maintenance in the laboratory, poor alignment by the users, or to artifacts in the way
"sensitivity" is being determined is not clear. I suspect that all three explanations are true.
One major problem with this method is the relatively long extrapolation needed to determine
sensitivity. The dimmest bead has a fluorescence value of about 18,000 units and the
the corresponding mean channel number obtained on the flow cytometer is plotted (Fig. 1).
The intersection of this regression with the mean channel of the "non-fluorescent" beads is
MESF
(Molecules of
Equivalent
Soluble
Fluorochrome)
100,000
10,000
1,000
100
. /
1.I /
o
50
\=
3?
4 / '
~.
1
J
I
I
.L
'!Il:
1
---t100
150
MEAN CHAIUIEL
Figure 1. Example of a calibration curve using beads of known fluorescence intensity (Flow Cytometry Standards
Corporation). A regression line is calculated based on the mean fluorescence of beads 1 through 4 and this
line is then extrapolated to the mean of non-fluorescent beads (B). This intercept is reported as the instrument
sensitivity. Linearity is calculated from the goodness of fit of the regression.
used as a measure of sensitivity. The goodness of fit of the linear regression (r) is used as
a measure of linearity.
This approach has proven to be feasible and has been applied in at least two informal surveys
of large numbers of laboratories using different instruments. The results can best be
summarized by saying that there are remarkably wide variations in sensitivity, even within the
same model of flow cytometer. For example, in one published survey (1) the variation in
sensitivity in all 110 instruments surveyed was from about 200 molecules of fluorescein to
more than 16,000 molecules. (The units of fluorescence used by the company are "molecules
of equivalent soluble fluorochrome" which we will discuss later.) In this survey the most
frequently tested instrument was represented 39 times and the sensitivity measurements for
that instrument varied from 200 to about 1200. Whether these variations are due to poor
maintenance in the laboratory, poor alignment by the users, or to artifacts in the way
"sensitivity" is being determined is not clear. I suspect that all three explanations are true.
One major problem with this method is the relatively long extrapolation needed to determine
sensitivity. The dimmest bead has a fluorescence value of about 18,000 units and the