

383
cytometric analyses offer the potential for added specificity since discrete components of the
community can be followed, which reduces the potential for interference by changes in the
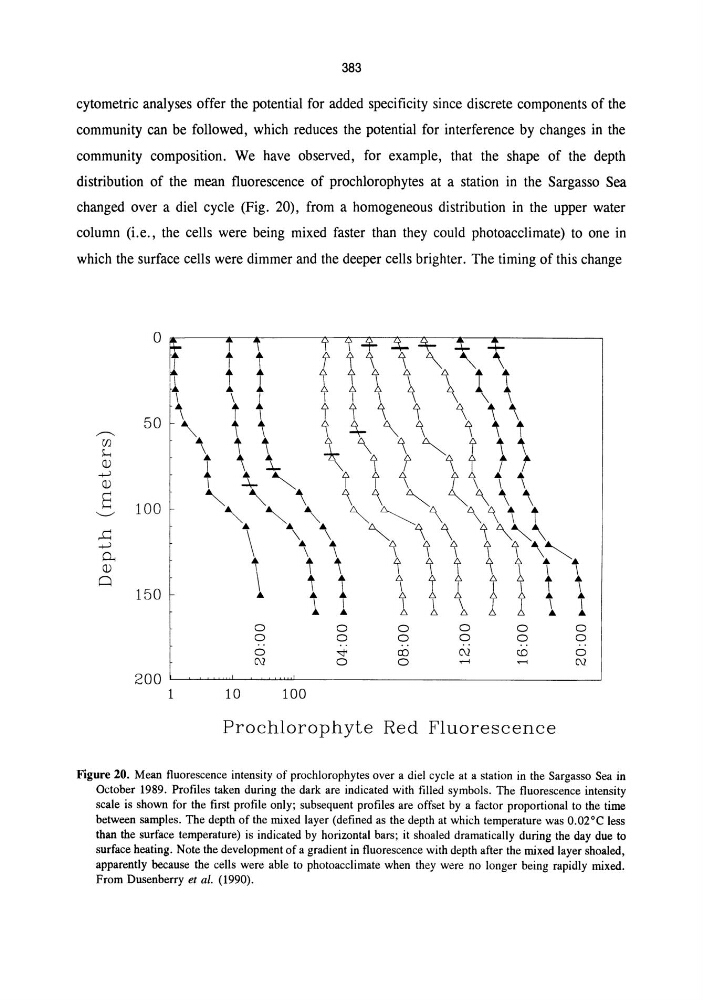
community composition. We have observed, for example, that the shape of the depth
distribution of the mean fluorescence of prochlorophytes at a station in the Sargasso Sea
changed over a diel cycle (Fig. 20), from a homogeneous distribution in the upper water
column (i.e., the cells were being mixed faster than they could photoacclimate) to one in
which the surface cells were dimmer and the deeper cells brighter. The timing of this change
200
1
10
o
o
o
C\l
100
o
o
-.:t<
o
o
o
en
o
o
o
C\l
..--<
o
o
CD
..--<
Prochlorophyte Red Fluorescence
o
o
o
C\l
Figure 20. Mean fluorescence intensity of prochlorophytes over a diel cycle at a station in the Sargasso Sea in
October 1989. Profiles taken during the dark are indicated with filled symbols. The fluorescence intensity
scale is shown for the first profile only; subsequent profiles are offset by a factor proportional to the time
between samples. The depth of the mixed layer (defined as the depth at which temperature was 0.02°C less
than the surface temperature) is indicated by horizontal bars; it shoaled dramatically during the day due to
surface heating. Note the development of a gradient in fluorescence with depth after the mixed layer shoaled,
apparently because the cells were able to photoacclimate when they were no longer being rapidly mixed.
From Dusenberry et al. (1990).
cytometric analyses offer the potential for added specificity since discrete components of the
community can be followed, which reduces the potential for interference by changes in the
community composition. We have observed, for example, that the shape of the depth
distribution of the mean fluorescence of prochlorophytes at a station in the Sargasso Sea
changed over a diel cycle (Fig. 20), from a homogeneous distribution in the upper water
column (i.e., the cells were being mixed faster than they could photoacclimate) to one in
which the surface cells were dimmer and the deeper cells brighter. The timing of this change
200
1
10
o
o
o
C\l
100
o
o
-.:t<
o
o
o
en
o
o
o
C\l
..--<
o
o
CD
..--<
Prochlorophyte Red Fluorescence
o
o
o
C\l
Figure 20. Mean fluorescence intensity of prochlorophytes over a diel cycle at a station in the Sargasso Sea in
October 1989. Profiles taken during the dark are indicated with filled symbols. The fluorescence intensity
scale is shown for the first profile only; subsequent profiles are offset by a factor proportional to the time
between samples. The depth of the mixed layer (defined as the depth at which temperature was 0.02°C less
than the surface temperature) is indicated by horizontal bars; it shoaled dramatically during the day due to
surface heating. Note the development of a gradient in fluorescence with depth after the mixed layer shoaled,
apparently because the cells were able to photoacclimate when they were no longer being rapidly mixed.
From Dusenberry et al. (1990).