

381
intracellular esterases. The resulting fluorescein molecule is fluorescent and hydrophilic (thus
it cannot easily pass back through the cell membrane).
Dorsey et al. (1989) used flow cytometry to quantify the uptake of FDA by a variety of
phytoplankton cultures. All phytoplankton investigated (five classes of eukaryotes and one
prokaryotic Synechococcus) accumulated FDA and exhibited fluorescein fluorescence which
peaked about eight minutes after the addition. FDA activity and photosynthetic activity both
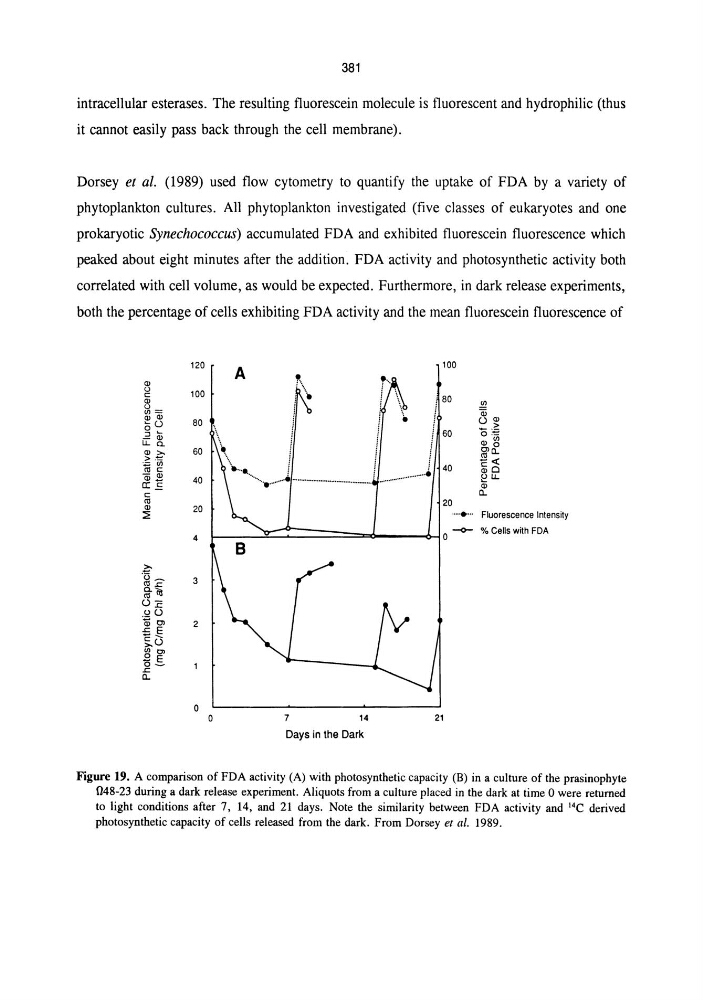
correlated with cell volume, as would be expected. Furthermore, in dark release experiments,
both the percentage of cells exhibiting FDA activity and the mean fluorescein fluorescence of
' "
()
c:
' "
~=
' " ' "
0°
~ Qj
LLa.
"'>- > :~
' ' ;:::; en
ctl c:
Cii2
CJ:.!::
c:
ctl
'"
::i:
120
A
100
100
; 80
80
60 \ \
!
........ "., •......... ~............................................. ............. .........• 40
! 60
40
20
4
o
20
......... Fluorescence Intensity
I------.:~~~======,J..---~ 0 - 0 - % Cells with FDA
o
7
14
21
Days in the Dark
Figure 19. A comparison of FDA activity (A) with photosynthetic capacity (B) in a culture of the prasinophyte
048-23 during a dark release experiment. Aliquots from a culture placed in the dark at time 0 were returned
to light conditions after 7, 14, and 21 days. Note the similarity between FDA activity and 14C derived
photosynthetic capacity of cells released from the dark. From Dorsey et al. 1989.
intracellular esterases. The resulting fluorescein molecule is fluorescent and hydrophilic (thus
it cannot easily pass back through the cell membrane).
Dorsey et al. (1989) used flow cytometry to quantify the uptake of FDA by a variety of
phytoplankton cultures. All phytoplankton investigated (five classes of eukaryotes and one
prokaryotic Synechococcus) accumulated FDA and exhibited fluorescein fluorescence which
peaked about eight minutes after the addition. FDA activity and photosynthetic activity both
correlated with cell volume, as would be expected. Furthermore, in dark release experiments,
both the percentage of cells exhibiting FDA activity and the mean fluorescein fluorescence of
' "
()
c:
' "
~=
' " ' "
0°
~ Qj
LLa.
"'>- > :~
' ' ;:::; en
ctl c:
Cii2
CJ:.!::
c:
ctl
'"
::i:
120
A
100
100
; 80
80
60 \ \
!
........ "., •......... ~............................................. ............. .........• 40
! 60
40
20
4
o
20
......... Fluorescence Intensity
I------.:~~~======,J..---~ 0 - 0 - % Cells with FDA
o
7
14
21
Days in the Dark
Figure 19. A comparison of FDA activity (A) with photosynthetic capacity (B) in a culture of the prasinophyte
048-23 during a dark release experiment. Aliquots from a culture placed in the dark at time 0 were returned
to light conditions after 7, 14, and 21 days. Note the similarity between FDA activity and 14C derived
photosynthetic capacity of cells released from the dark. From Dorsey et al. 1989.