

379
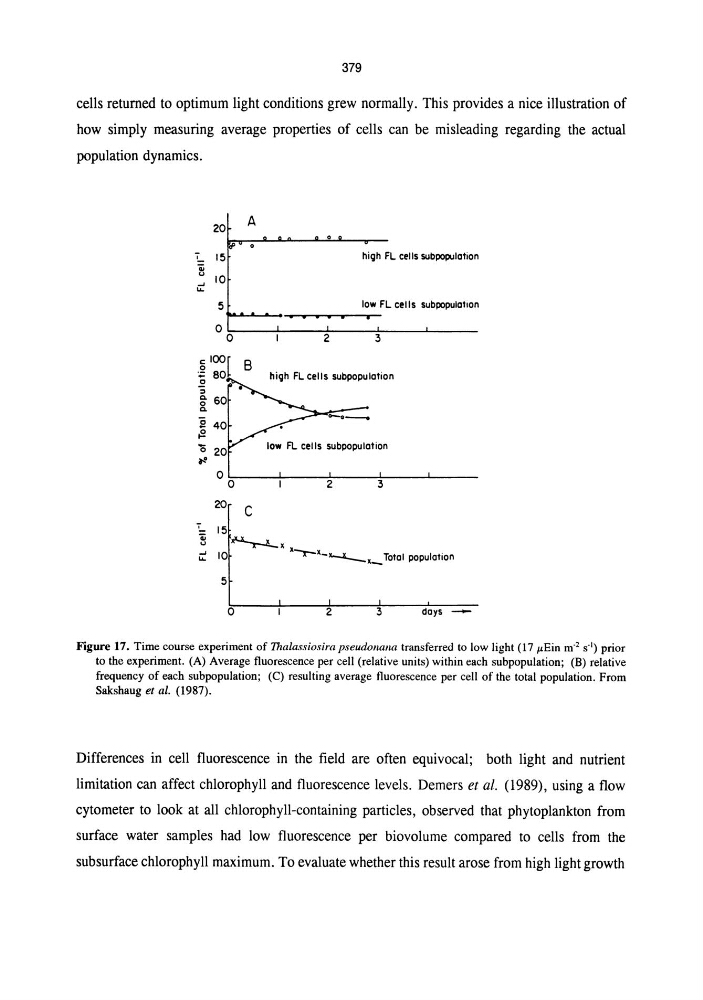
cells returned to optimum light conditions grew normally. This provides a nice illustration of
how simply measuring average properties of cells can be misleading regarding the actual
population dynamics.
20
A
'- 15
hi9h FL cells subpopulatian
Ii u 10
...J
II.
5
law FL cells subpopulOtion
. .
0 0
2
:3
c 100 B
0
:;: 80
~
hi9h FL cells subpopulotion
:>
g. 60
Q.
"0 20
tt
0 0
2
:3
20
C
5
o
2
doys -
Figure 17. Time course experiment of Thalassiosira pseudonana transferred to low light (17 /LEin m- 2 S-I) prior
to the experiment. (A) Average fluorescence per cell (relative units) within each subpopulation; (B) relative
frequency of each subpopulation; (C) resulting average fluorescence per cell of the total population. From
Sakshaug et al. (1987).
Differences in cell fluorescence in the field are often equivocal; both light and nutrient
limitation can affect chlorophyll and fluorescence levels. Demers et al. (1989), using a flow
cytometer to look at all chlorophyll-containing particles, observed that phytoplankton from
surface water samples had low fluorescence per biovolume compared to cells from the
subsurface chlorophyll maximum. To evaluate whether this result arose from high light growth
cells returned to optimum light conditions grew normally. This provides a nice illustration of
how simply measuring average properties of cells can be misleading regarding the actual
population dynamics.
20
A
'- 15
hi9h FL cells subpopulatian
Ii u 10
...J
II.
5
law FL cells subpopulOtion
. .
0 0
2
:3
c 100 B
0
:;: 80
~
hi9h FL cells subpopulotion
:>
g. 60
Q.
"0 20
tt
0 0
2
:3
20
C
5
o
2
doys -
Figure 17. Time course experiment of Thalassiosira pseudonana transferred to low light (17 /LEin m- 2 S-I) prior
to the experiment. (A) Average fluorescence per cell (relative units) within each subpopulation; (B) relative
frequency of each subpopulation; (C) resulting average fluorescence per cell of the total population. From
Sakshaug et al. (1987).
Differences in cell fluorescence in the field are often equivocal; both light and nutrient
limitation can affect chlorophyll and fluorescence levels. Demers et al. (1989), using a flow
cytometer to look at all chlorophyll-containing particles, observed that phytoplankton from
surface water samples had low fluorescence per biovolume compared to cells from the
subsurface chlorophyll maximum. To evaluate whether this result arose from high light growth