

222
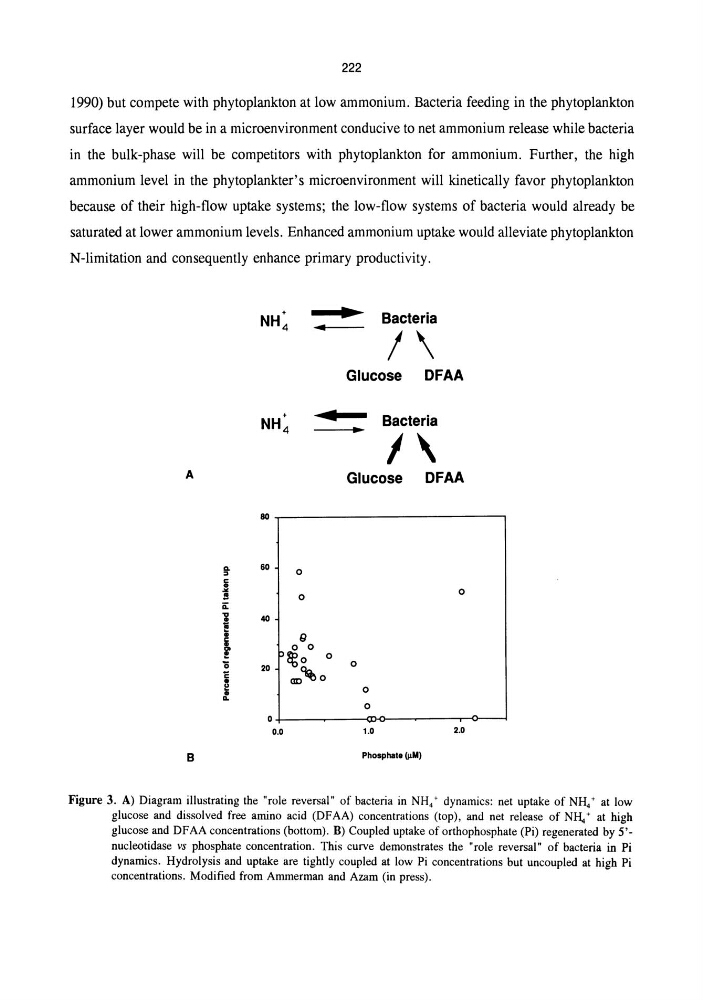
1990) but compete with phytoplankton at low ammonium. Bacteria feeding in the phytoplankton
surface layer would be in a microenvironment conducive to net ammonium release while bacteria
in the bulk-phase will be competitors with phytoplankton for ammonium. Further, the high
ammonium level in the phytoplankter's microenvironment will kinetically favor phytoplankton
because of their high-flow uptake systems; the low-flow systems of bacteria would already be
saturated at lower ammonium levels. Enhanced ammonium uptake would alleviate phytoplankton
N-limitation and consequently enhance primary productivity .
+
•
NH4
Bacteria
..
I \
Glucose DFAA
+
•
NH4
Bacteria
..
I \
A
Glucose
DFAA
80
a.
60
0
" 51
...
0
s
0
;;:
"i
40
;
9
51
o 0
~
P~o
0
"0
20
0
C
CID~O
•
~
0
a.
0
0
0.0
1.0
2.0
B
Phosphat. (!lM)
Figure 3. A) Diagram illustrating the "role reversal" of bacteria in NH/ dynamics: net uptake of NH/ at low
glucose and dissolved free amino acid (DFAA) concentrations (top), and net release of NH., + at high
glucose and DFAA concentrations (bottom). B) Coupled uptake of orthophosphate (Pi) regenerated by 5'nucleotidase vs phosphate concentration. This curve demonstrates the "role reversal" of bacteria in Pi
dynamics. Hydrolysis and uptake are tightly coupled at low Pi concentrations but uncoupled at high Pi
concentrations. Modified from Ammerman and Azam (in press).
1990) but compete with phytoplankton at low ammonium. Bacteria feeding in the phytoplankton
surface layer would be in a microenvironment conducive to net ammonium release while bacteria
in the bulk-phase will be competitors with phytoplankton for ammonium. Further, the high
ammonium level in the phytoplankter's microenvironment will kinetically favor phytoplankton
because of their high-flow uptake systems; the low-flow systems of bacteria would already be
saturated at lower ammonium levels. Enhanced ammonium uptake would alleviate phytoplankton
N-limitation and consequently enhance primary productivity .
+
•
NH4
Bacteria
..
I \
Glucose DFAA
+
•
NH4
Bacteria
..
I \
A
Glucose
DFAA
80
a.
60
0
" 51
...
0
s
0
;;:
"i
40
;
9
51
o 0
~
P~o
0
"0
20
0
C
CID~O
•
~
0
a.
0
0
0.0
1.0
2.0
B
Phosphat. (!lM)
Figure 3. A) Diagram illustrating the "role reversal" of bacteria in NH/ dynamics: net uptake of NH/ at low
glucose and dissolved free amino acid (DFAA) concentrations (top), and net release of NH., + at high
glucose and DFAA concentrations (bottom). B) Coupled uptake of orthophosphate (Pi) regenerated by 5'nucleotidase vs phosphate concentration. This curve demonstrates the "role reversal" of bacteria in Pi
dynamics. Hydrolysis and uptake are tightly coupled at low Pi concentrations but uncoupled at high Pi
concentrations. Modified from Ammerman and Azam (in press).