

220
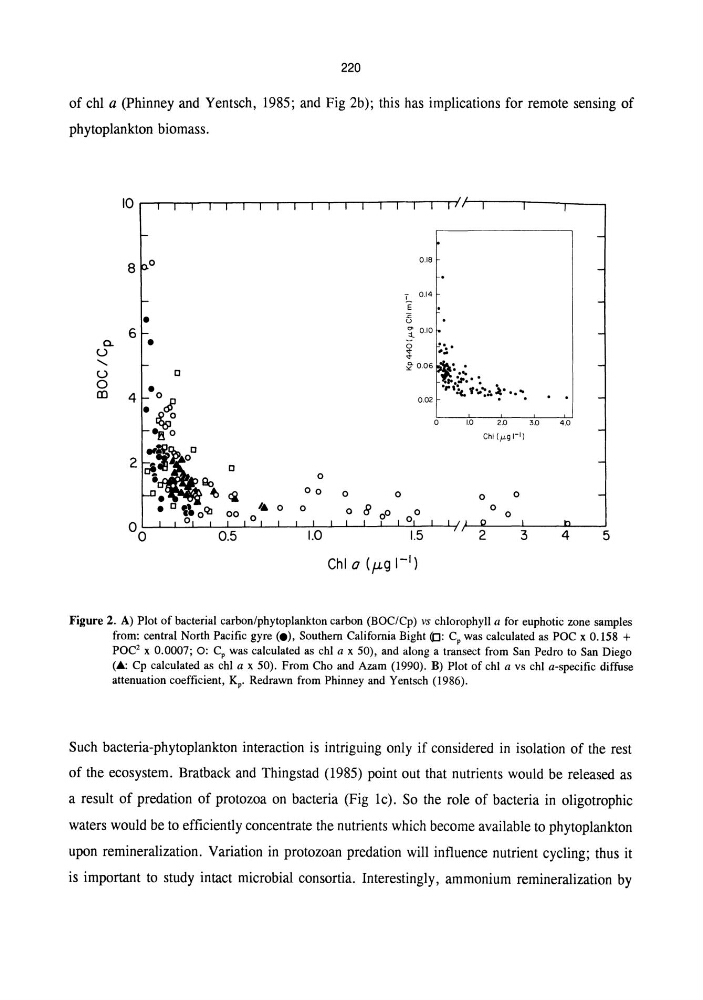
of chI a (phinney and Yentsch, 1985; and Fig 2b); this has implications for remote sensing of
phytoplankton biomass.
a.
U
.......
U
o
OJ
8 0
•
6
•
o
•
4 0
.~
-H o
2~lO 0
•
90
. ~ ~
• 0 '\0Q] 00
o
0.5
0
00
4 0 0
0
1.0
0
0
0
8 00
0.18
L 0.14
E
E
u
~ 0.10
o
"
" ~ 0.06 ~ •
0
...
.... ;.r •• : .
r ':, f ... ~ ... ~ • .....
0.02
o
1.0
2.0
Chi l,ug I-I)
0
0
0
0 0
1.5
2
3
Chi a (fLg I-I)
3.0
4.0
4
5
Figure 2. A) Plot of bacterial carbon/phytoplankton carbon (BOC/Cp) vs chlorophyll a for euphotic zone samples
from: central North Pacific gyre (e), Southern California Bight ([]: C p was calculated as POC x 0.158 +
POC 2 x 0.0007; 0: Cp was calculated as chi a x 50), and along a transect from San Pedro to San Diego
(A: Cp calculated as chi a x 50). From Cho and Azam (1990). B) Plot of chi a vs chi a-specific diffuse
attenuation coefficient, Kp. Redrawn from Phinney and Yentsch (1986).
Such bacteria-phytoplankton interaction is intriguing only if considered in isolation of the rest
of the ecosystem. Bratback and Thingstad (1985) point out that nutrients would be released as
a result of predation of protozoa on bacteria (Fig lc). So the role of bacteria in oligotrophic
waters would be to efficiently concentrate the nutrients which become available to phytoplankton
upon remineralization. Variation in protozoan predation will influence nutrient cycling; thus it
is important to study intact microbial consortia. Interestingly, ammonium remineralization by
of chI a (phinney and Yentsch, 1985; and Fig 2b); this has implications for remote sensing of
phytoplankton biomass.
a.
U
.......
U
o
OJ
8 0
•
6
•
o
•
4 0
.~
-H o
2~lO 0
•
90
. ~ ~
• 0 '\0Q] 00
o
0.5
0
00
4 0 0
0
1.0
0
0
0
8 00
0.18
L 0.14
E
E
u
~ 0.10
o
"
" ~ 0.06 ~ •
0
...
.... ;.r •• : .
r ':, f ... ~ ... ~ • .....
0.02
o
1.0
2.0
Chi l,ug I-I)
0
0
0
0 0
1.5
2
3
Chi a (fLg I-I)
3.0
4.0
4
5
Figure 2. A) Plot of bacterial carbon/phytoplankton carbon (BOC/Cp) vs chlorophyll a for euphotic zone samples
from: central North Pacific gyre (e), Southern California Bight ([]: C p was calculated as POC x 0.158 +
POC 2 x 0.0007; 0: Cp was calculated as chi a x 50), and along a transect from San Pedro to San Diego
(A: Cp calculated as chi a x 50). From Cho and Azam (1990). B) Plot of chi a vs chi a-specific diffuse
attenuation coefficient, Kp. Redrawn from Phinney and Yentsch (1986).
Such bacteria-phytoplankton interaction is intriguing only if considered in isolation of the rest
of the ecosystem. Bratback and Thingstad (1985) point out that nutrients would be released as
a result of predation of protozoa on bacteria (Fig lc). So the role of bacteria in oligotrophic
waters would be to efficiently concentrate the nutrients which become available to phytoplankton
upon remineralization. Variation in protozoan predation will influence nutrient cycling; thus it
is important to study intact microbial consortia. Interestingly, ammonium remineralization by