

157
3.0
E, huxleyi
2.5
./
_ '...:::,~ - - - - - - - _ci~at~ _ _ _ _ _ _ _ _ _ -r~~',
/
2.0
/
r
1.5LH. elongata
I
" ,
./-~~"
/ ' \
I
. . . . . . <
---/
I
-t
./~- "
\
I
I
1.0
./
'
\ /
l'
, . /
\
I
i'"
././
f l agel l at es
/
l "./
r . . . . . ....... . .......
'W
O
" . " " , , , ,
- - - - -1
.~ L~_~_·_te_"·-'_'_'_·.·_'_I_' -, -, -,'-'1"-','-'-' ,-"' -Jl
400
450
500
550
600
650
700
750
A. [nm]
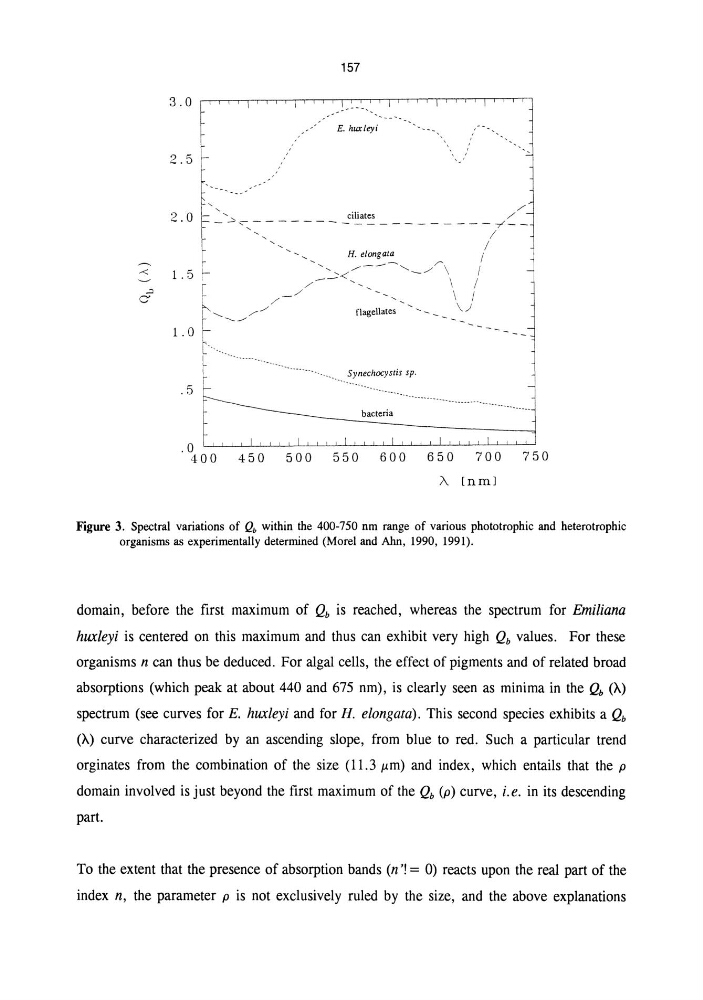
Figure 3. Spectral variations of Qb within the 400-750 nm range of various phototrophic and heterotrophic
organisms as experimentally determined (Morel and Ahn, 1990, 1991).
domain, before the first maximum of Qb is reached, whereas the spectrum for Emiliana
huxZeyi is centered on this maximum and thus can exhibit very high Qb values. For these
organisms n can thus be deduced. For algal cells, the effect of pigments and of related broad
absorptions (which peak at about 440 and 675 nm), is clearly seen as minima in the Qb (A)
spectrum (see curves for E. huxZeyi and for H. eZongata). This second species exhibits a Qb
(A) curve characterized by an ascending slope, from blue to red. Such a particular trend
orginates from the combination of the size (11.3 f(m) and index, which entails that the p
domain involved is just beyond the first maximum of the Qb (p) curve, i. e. in its descending
part.
To the extent that the presence of absorption bands (n '! = 0) reacts upon the real part of the
index n, the parameter p is not exclusively ruled by the size, and the above explanations
3.0
E, huxleyi
2.5
./
_ '...:::,~ - - - - - - - _ci~at~ _ _ _ _ _ _ _ _ _ -r~~',
/
2.0
/
r
1.5LH. elongata
I
" ,
./-~~"
/ ' \
I
. . . . . . <
---/
I
-t
./~- "
\
I
I
1.0
./
'
\ /
l'
, . /
\
I
i'"
././
f l agel l at es
/
l "./
r . . . . . ....... . .......
'W
O
" . " " , , , ,
- - - - -1
.~ L~_~_·_te_"·-'_'_'_·.·_'_I_' -, -, -,'-'1"-','-'-' ,-"' -Jl
400
450
500
550
600
650
700
750
A. [nm]
Figure 3. Spectral variations of Qb within the 400-750 nm range of various phototrophic and heterotrophic
organisms as experimentally determined (Morel and Ahn, 1990, 1991).
domain, before the first maximum of Qb is reached, whereas the spectrum for Emiliana
huxZeyi is centered on this maximum and thus can exhibit very high Qb values. For these
organisms n can thus be deduced. For algal cells, the effect of pigments and of related broad
absorptions (which peak at about 440 and 675 nm), is clearly seen as minima in the Qb (A)
spectrum (see curves for E. huxZeyi and for H. eZongata). This second species exhibits a Qb
(A) curve characterized by an ascending slope, from blue to red. Such a particular trend
orginates from the combination of the size (11.3 f(m) and index, which entails that the p
domain involved is just beyond the first maximum of the Qb (p) curve, i. e. in its descending
part.
To the extent that the presence of absorption bands (n '! = 0) reacts upon the real part of the
index n, the parameter p is not exclusively ruled by the size, and the above explanations