

148
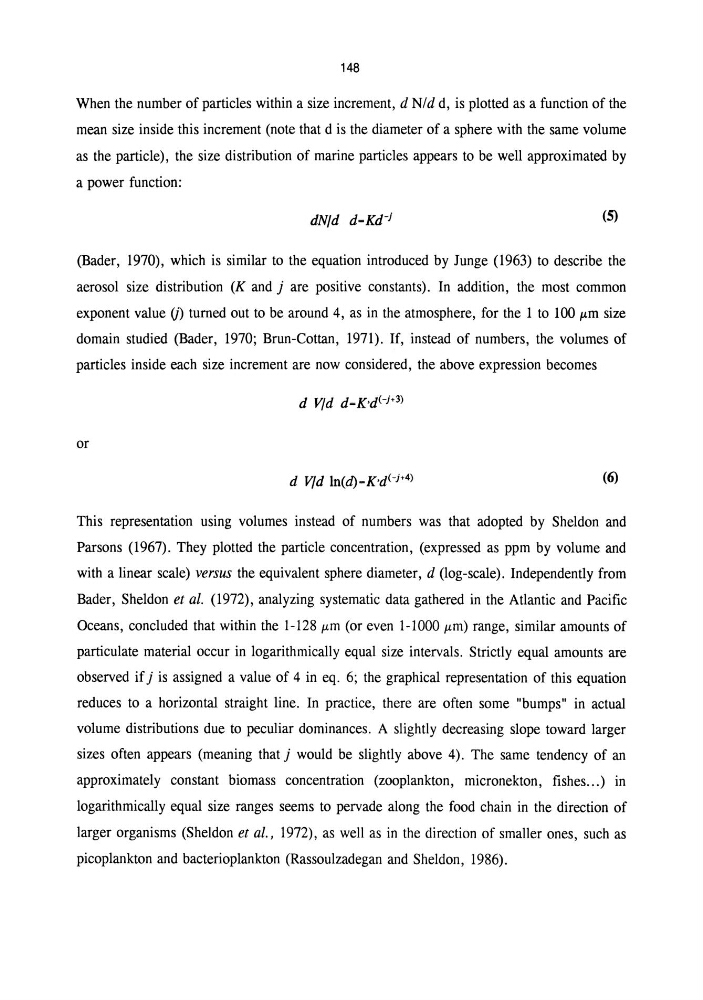
When the number of particles within a size increment, d N/d d, is plotted as a function of the
mean size inside this increment (note that d is the diameter of a sphere with the same volume
as the particle), the size distribution of marine particles appears to be well approximated by
a power function:
dNld d-Kd- j
(5)
(Bader, 1970), which is similar to the equation introduced by Junge (1963) to describe the
aerosol size distribution (K and j are positive constants). In addition, the most common
exponent value (J) turned out to be around 4, as in the atmosphere, for the 1 to 100 I'm size
domain studied (Bader, 1970; Brun-Cottan, 1971). If, instead of numbers, the volumes of
particles inside each size increment are now considered, the above expression becomes
or
(6)
This representation using volumes instead of numbers was that adopted by Sheldon and
Parsons (1967). They plotted the particle concentration, (expressed as ppm by volume and
with a linear scale) versus the equivalent sphere diameter, d (log-scale). Independently from
Bader, Sheldon et al. (1972), analyzing systematic data gathered in the Atlantic and Pacific
Oceans, concluded that within the 1-128 I'm (or even 1-1000 I'm) range, similar amounts of
particulate material occur in logarithmically equal size intervals. Strictly equal amounts are
observed if j is assigned a value of 4 in eq. 6; the graphical representation of this equation
reduces to a horizontal straight line. In practice, there are often some "bumps" in actual
volume distributions due to peculiar dominances. A slightly decreasing slope toward larger
sizes often appears (meaning that j would be slightly above 4). The same tendency of an
approximately constant biomass concentration (zooplankton, micronekton, fishes ... ) in
logarithmically equal size ranges seems to pervade along the food chain in the direction of
larger organisms (Sheldon et al., 1972), as well as in the direction of smaller ones, such as
picoplankton and bacterioplankton (Rassoulzadegan and Sheldon, 1986).
When the number of particles within a size increment, d N/d d, is plotted as a function of the
mean size inside this increment (note that d is the diameter of a sphere with the same volume
as the particle), the size distribution of marine particles appears to be well approximated by
a power function:
dNld d-Kd- j
(5)
(Bader, 1970), which is similar to the equation introduced by Junge (1963) to describe the
aerosol size distribution (K and j are positive constants). In addition, the most common
exponent value (J) turned out to be around 4, as in the atmosphere, for the 1 to 100 I'm size
domain studied (Bader, 1970; Brun-Cottan, 1971). If, instead of numbers, the volumes of
particles inside each size increment are now considered, the above expression becomes
or
(6)
This representation using volumes instead of numbers was that adopted by Sheldon and
Parsons (1967). They plotted the particle concentration, (expressed as ppm by volume and
with a linear scale) versus the equivalent sphere diameter, d (log-scale). Independently from
Bader, Sheldon et al. (1972), analyzing systematic data gathered in the Atlantic and Pacific
Oceans, concluded that within the 1-128 I'm (or even 1-1000 I'm) range, similar amounts of
particulate material occur in logarithmically equal size intervals. Strictly equal amounts are
observed if j is assigned a value of 4 in eq. 6; the graphical representation of this equation
reduces to a horizontal straight line. In practice, there are often some "bumps" in actual
volume distributions due to peculiar dominances. A slightly decreasing slope toward larger
sizes often appears (meaning that j would be slightly above 4). The same tendency of an
approximately constant biomass concentration (zooplankton, micronekton, fishes ... ) in
logarithmically equal size ranges seems to pervade along the food chain in the direction of
larger organisms (Sheldon et al., 1972), as well as in the direction of smaller ones, such as
picoplankton and bacterioplankton (Rassoulzadegan and Sheldon, 1986).