

86
Chapter 10
displacements may be very different depending on the particular couple of
days which is selected. For instance, the displacements corresponding to
changes from day 2 to 28 and from day 1 to 27 give rise to perpendicular
vectors. A reliable interpretation of these spectral signatures in terms of LAI
changes may therefore be quite difficult in the absence of appropriate
angular effect processing. By contrast, the hourly observations of SEVIRI
show daily trajectories which change in shape as the LAI increases. These
daily trajectories are also shifted when LAI goes from two to three. Spectral
signatures corresponding to observations acquired at different Sun zenith
angles are also quite spread out. A consistent exploitation of these spectral
signatures requires accounting for the Sun position. Hence, though angular
effects appear as perturbations or “noise” in the case of polar observations,
they may convey relevant information in the case of the geostationary
observations, if there are properly exploited. These angular variations are
now explored in details.
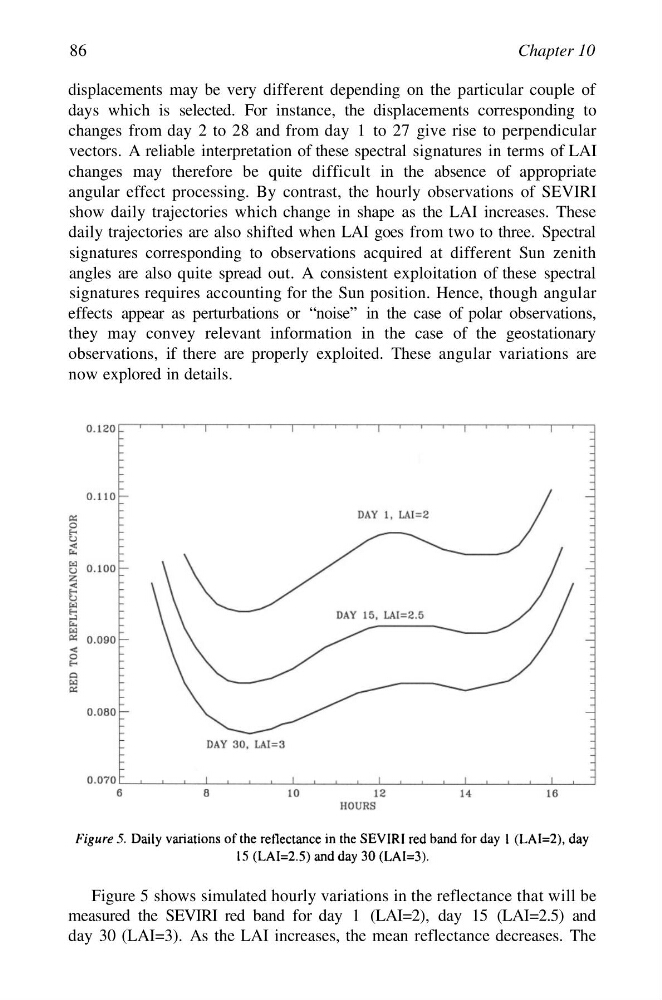
Figure 5 shows simulated hourly variations in the reflectance that will be
measured the SEVIRI red band for day 1 (LAI=2), day 15 (LAI=2.5) and
day 30 (LAI=3). As the LAI increases, the mean reflectance decreases. The
Chapter 10
displacements may be very different depending on the particular couple of
days which is selected. For instance, the displacements corresponding to
changes from day 2 to 28 and from day 1 to 27 give rise to perpendicular
vectors. A reliable interpretation of these spectral signatures in terms of LAI
changes may therefore be quite difficult in the absence of appropriate
angular effect processing. By contrast, the hourly observations of SEVIRI
show daily trajectories which change in shape as the LAI increases. These
daily trajectories are also shifted when LAI goes from two to three. Spectral
signatures corresponding to observations acquired at different Sun zenith
angles are also quite spread out. A consistent exploitation of these spectral
signatures requires accounting for the Sun position. Hence, though angular
effects appear as perturbations or “noise” in the case of polar observations,
they may convey relevant information in the case of the geostationary
observations, if there are properly exploited. These angular variations are
now explored in details.
Figure 5 shows simulated hourly variations in the reflectance that will be
measured the SEVIRI red band for day 1 (LAI=2), day 15 (LAI=2.5) and
day 30 (LAI=3). As the LAI increases, the mean reflectance decreases. The