

234
Chapter 24
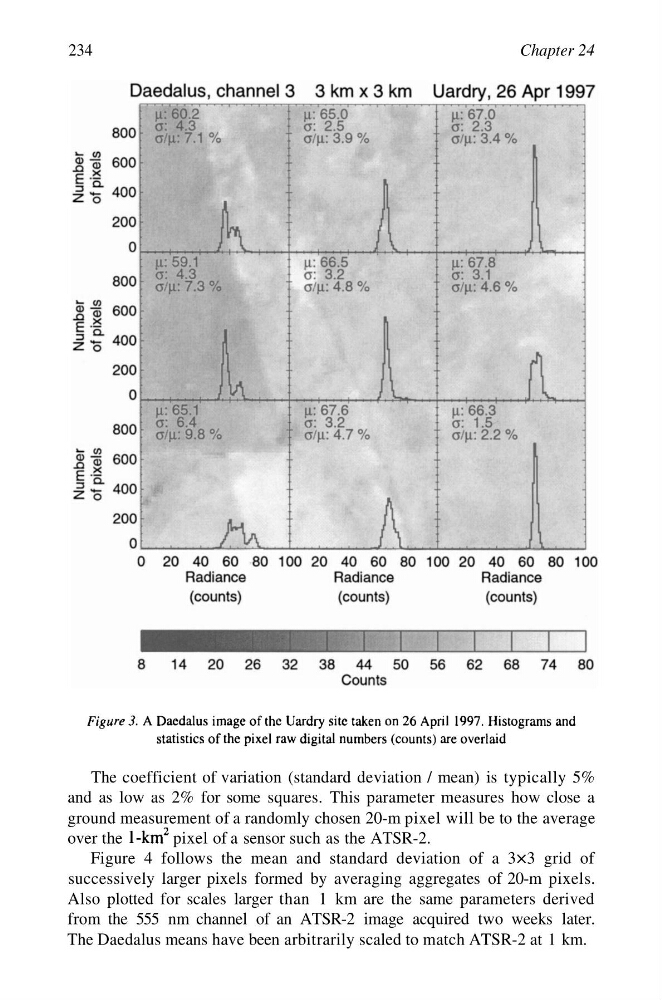
The coefficient of variation (standard deviation / mean) is typically 5%
and as low as 2% for some squares. This parameter measures how close a
ground measurement of a randomly chosen 20-m pixel will be to the average
over the
pixel of a sensor such as the ATSR-2.
Figure 4 follows the mean and standard deviation of a 3×3 grid of
successively larger pixels formed by averaging aggregates of 20-m pixels.
Also plotted for scales larger than 1 km are the same parameters derived
from the 555 nm channel of an ATSR-2 image acquired two weeks later.
The Daedalus means have been arbitrarily scaled to match ATSR-2 at 1 km.
Chapter 24
The coefficient of variation (standard deviation / mean) is typically 5%
and as low as 2% for some squares. This parameter measures how close a
ground measurement of a randomly chosen 20-m pixel will be to the average
over the
pixel of a sensor such as the ATSR-2.
Figure 4 follows the mean and standard deviation of a 3×3 grid of
successively larger pixels formed by averaging aggregates of 20-m pixels.
Also plotted for scales larger than 1 km are the same parameters derived
from the 555 nm channel of an ATSR-2 image acquired two weeks later.
The Daedalus means have been arbitrarily scaled to match ATSR-2 at 1 km.