

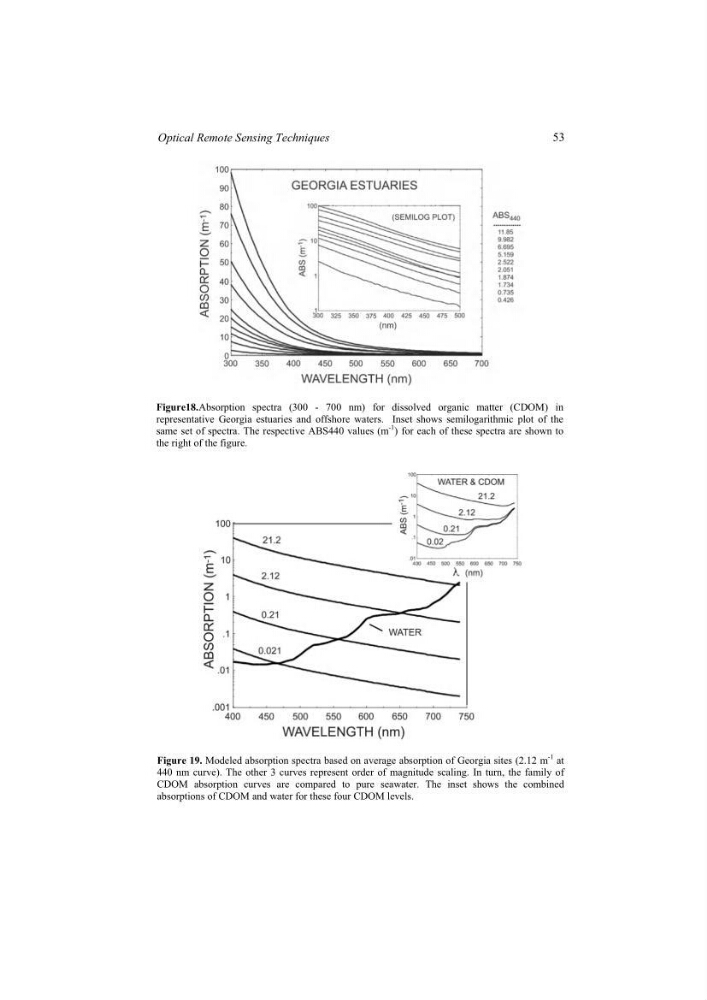
Figure18.Absorption spectra (300 - 700 nm) for dissolved organic matter (CDOM) in
representative Georgia estuaries and offshore waters. Inset shows semilogarithmic plot of the
same set of spectra. The respective ABS440 values (m
-1 ) for each of these spectra are shown to
the right of the figure.
Figure 19. Modeled absorption spectra based on average absorption of Georgia sites (2.12 m
-1 at
440 nm curve). The other 3 curves represent order of magnitude scaling. In turn, the family of
CDOM absorption curves are compared to pure seawater. The inset shows the combined
absorptions of CDOM and water for these four CDOM levels.
53
Optical Remote Sensing Techniques
representative Georgia estuaries and offshore waters. Inset shows semilogarithmic plot of the
same set of spectra. The respective ABS440 values (m
-1 ) for each of these spectra are shown to
the right of the figure.
Figure 19. Modeled absorption spectra based on average absorption of Georgia sites (2.12 m
-1 at
440 nm curve). The other 3 curves represent order of magnitude scaling. In turn, the family of
CDOM absorption curves are compared to pure seawater. The inset shows the combined
absorptions of CDOM and water for these four CDOM levels.
53
Optical Remote Sensing Techniques