

global ocean average of the proportions of each of the five classes of pigments from
Aiken et al. (1995). Note that the data in Figure 2 are scaled to a chl a concentration of
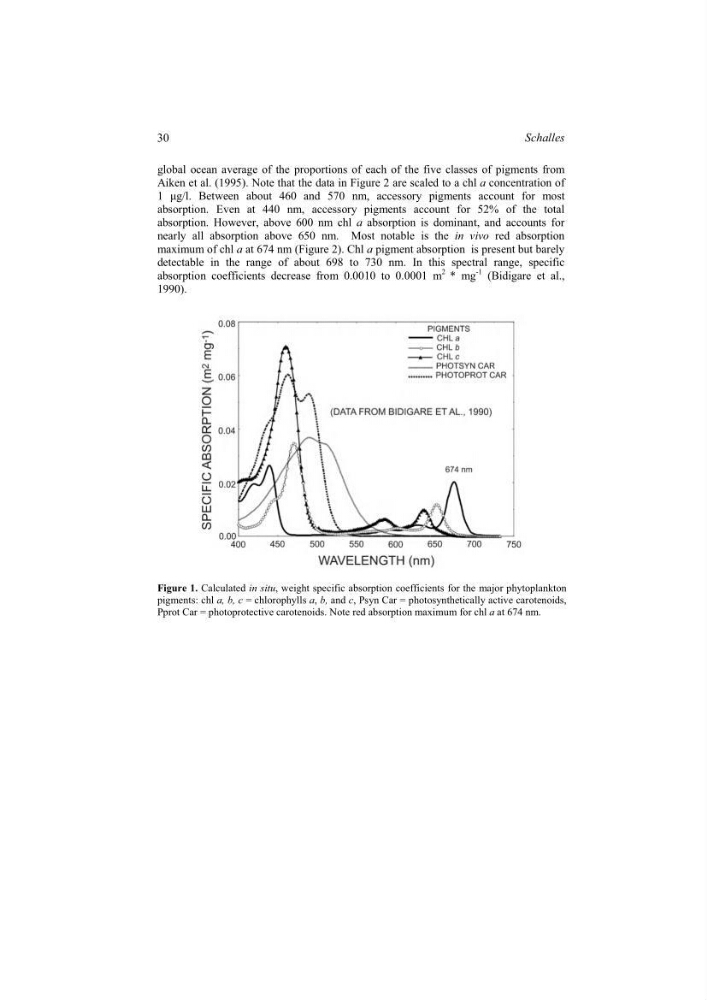
1 µg/l. Between about 460 and 570 nm, accessory pigments account for most
absorption. Even at 440 nm, accessory pigments account for 52% of the total
absorption. However, above 600 nm chl a absorption is dominant, and accounts for
nearly all absorption above 650 nm. Most notable is the in vivo red absorption
maximum of chl a at 674 nm (Figure 2). Chl a pigment absorption is present but barely
detectable in the range of about 698 to 730 nm. In this spectral range, specific
absorption coefficients decrease from 0.0010 to 0.0001 m
2 * mg
-1 (Bidigare et al.,
1990).
Figure 1. Calculated in situ, weight specific absorption coefficients for the major phytoplankton
pigments: chl a, b, c = chlorophylls a, b, and c, Psyn Car = photosynthetically active carotenoids,
Pprot Car = photoprotective carotenoids. Note red absorption maximum for chl a at 674 nm.
30
Schalles
Aiken et al. (1995). Note that the data in Figure 2 are scaled to a chl a concentration of
1 µg/l. Between about 460 and 570 nm, accessory pigments account for most
absorption. Even at 440 nm, accessory pigments account for 52% of the total
absorption. However, above 600 nm chl a absorption is dominant, and accounts for
nearly all absorption above 650 nm. Most notable is the in vivo red absorption
maximum of chl a at 674 nm (Figure 2). Chl a pigment absorption is present but barely
detectable in the range of about 698 to 730 nm. In this spectral range, specific
absorption coefficients decrease from 0.0010 to 0.0001 m
2 * mg
-1 (Bidigare et al.,
1990).
Figure 1. Calculated in situ, weight specific absorption coefficients for the major phytoplankton
pigments: chl a, b, c = chlorophylls a, b, and c, Psyn Car = photosynthetically active carotenoids,
Pprot Car = photoprotective carotenoids. Note red absorption maximum for chl a at 674 nm.
30
Schalles