

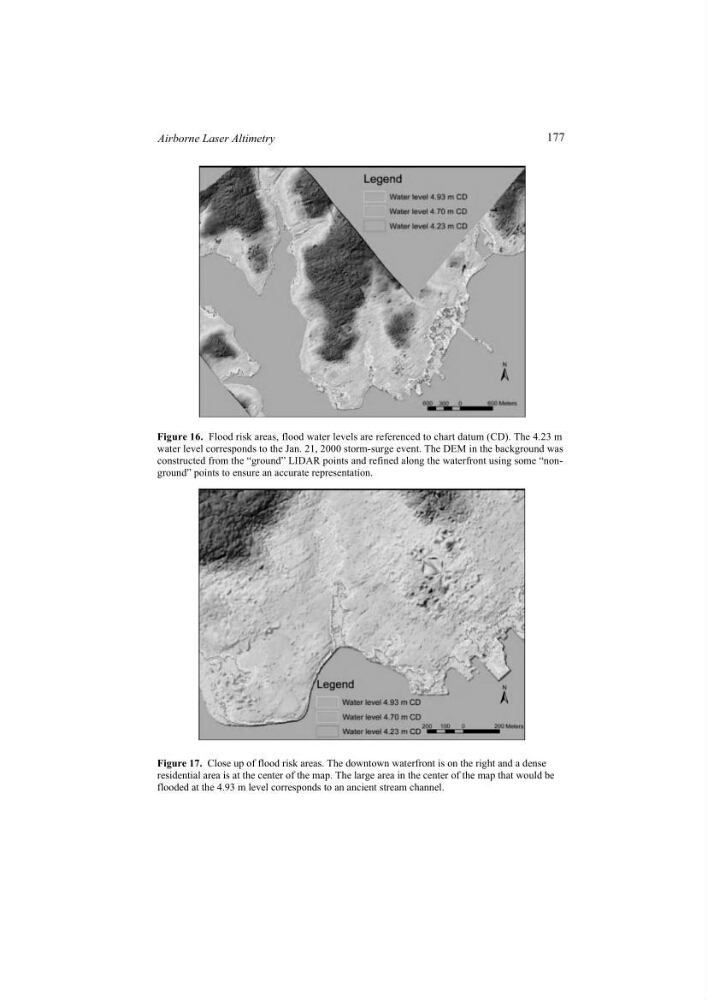
ground” points to ensure an accurate representation.
Figure 17. Close up of flood risk areas. The downtown waterfront is on the right and a dense
residential area is at the center of the map. The large area in the center of the map that would be
flooded at the 4.93 m level corresponds to an ancient stream channel.
Figure 16. Flood risk areas, flood water levels are referenced to chart datum (CD). The 4.23 m
water level corresponds to the Jan. 21, 2000 storm-surge event. The DEM in the background was
constructed from the “ground” LIDAR points and refined along the waterfront using some “non177
Airborne Laser Altimetry
Figure 17. Close up of flood risk areas. The downtown waterfront is on the right and a dense
residential area is at the center of the map. The large area in the center of the map that would be
flooded at the 4.93 m level corresponds to an ancient stream channel.
Figure 16. Flood risk areas, flood water levels are referenced to chart datum (CD). The 4.23 m
water level corresponds to the Jan. 21, 2000 storm-surge event. The DEM in the background was
constructed from the “ground” LIDAR points and refined along the waterfront using some “non177
Airborne Laser Altimetry