

0
0.1
0.2
0.3
0.4
0.5
0.6
0.7
33.6
33.8
34
34.2
34.4
34.6
34.8
35
35.2
35.4
35.6
35.8
36
36.2
36.4
36.6
36.8
37
37.2
37.4
37.6
Decimal Day
Fluorescent Yield (Fv = (Fm-Fo)/Fm)
PAM 1Yield
PAM 2 Yield
PAM 3 Yield
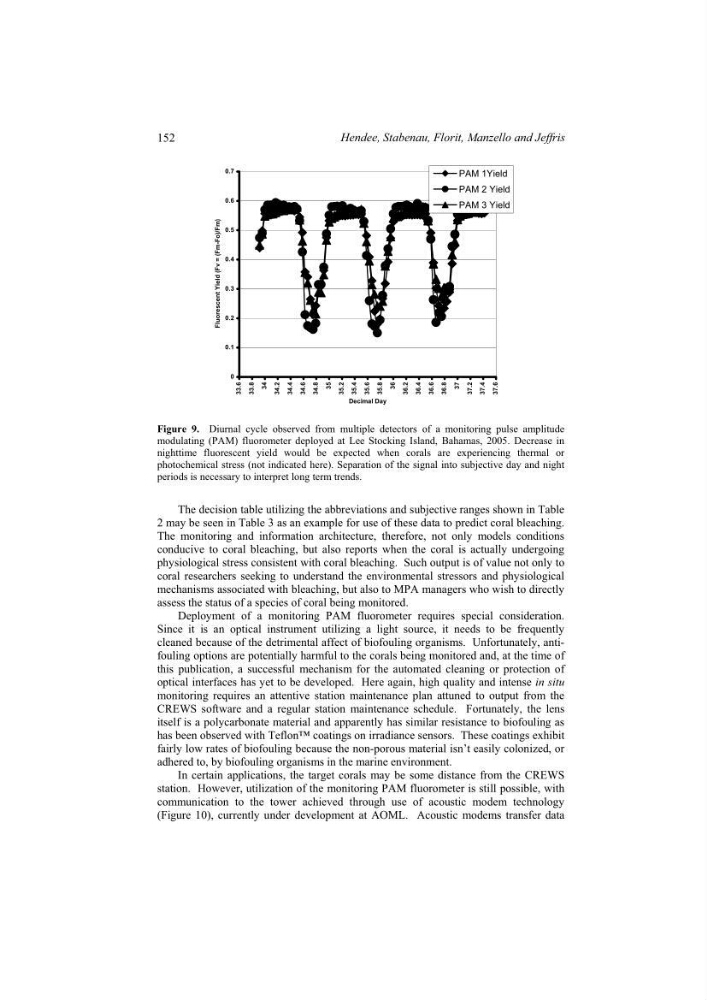
Figure 9. Diurnal cycle observed from multiple detectors of a monitoring pulse amplitude
modulating (PAM) fluorometer deployed at Lee Stocking Island, Bahamas, 2005. Decrease in
nighttime fluorescent yield would be expected when corals are experiencing thermal or
photochemical stress (not indicated here). Separation of the signal into subjective day and night
periods is necessary to interpret long term trends.
The decision table utilizing the abbreviations and subjective ranges shown in Table
2 may be seen in Table 3 as an example for use of these data to predict coral bleaching.
The monitoring and information architecture, therefore, not only models conditions
conducive to coral bleaching, but also reports when the coral is actually undergoing
physiological stress consistent with coral bleaching. Such output is of value not only to
coral researchers seeking to understand the environmental stressors and physiological
mechanisms associated with bleaching, but also to MPA managers who wish to directly
assess the status of a species of coral being monitored.
Deployment of a monitoring PAM fluorometer requires special consideration.
Since it is an optical instrument utilizing a light source, it needs to be frequently
cleaned because of the detrimental affect of biofouling organisms. Unfortunately, antifouling options are potentially harmful to the corals being monitored and, at the time of
this publication, a successful mechanism for the automated cleaning or protection of
optical interfaces has yet to be developed. Here again, high quality and intense in situ
monitoring requires an attentive station maintenance plan attuned to output from the
CREWS software and a regular station maintenance schedule. Fortunately, the lens
itself is a polycarbonate material and apparently has similar resistance to biofouling as
has been observed with Teflon™ coatings on irradiance sensors. These coatings exhibit
fairly low rates of biofouling because the non-porous material isn’t easily colonized, or
adhered to, by biofouling organisms in the marine environment.
In certain applications, the target corals may be some distance from the CREWS
station. However, utilization of the monitoring PAM fluorometer is still possible, with
communication to the tower achieved through use of acoustic modem technology
(Figure 10), currently under development at AOML. Acoustic modems transfer data
152
Hendee, Stabenau, Florit, Manzello and Jeffris
0.1
0.2
0.3
0.4
0.5
0.6
0.7
33.6
33.8
34
34.2
34.4
34.6
34.8
35
35.2
35.4
35.6
35.8
36
36.2
36.4
36.6
36.8
37
37.2
37.4
37.6
Decimal Day
Fluorescent Yield (Fv = (Fm-Fo)/Fm)
PAM 1Yield
PAM 2 Yield
PAM 3 Yield
Figure 9. Diurnal cycle observed from multiple detectors of a monitoring pulse amplitude
modulating (PAM) fluorometer deployed at Lee Stocking Island, Bahamas, 2005. Decrease in
nighttime fluorescent yield would be expected when corals are experiencing thermal or
photochemical stress (not indicated here). Separation of the signal into subjective day and night
periods is necessary to interpret long term trends.
The decision table utilizing the abbreviations and subjective ranges shown in Table
2 may be seen in Table 3 as an example for use of these data to predict coral bleaching.
The monitoring and information architecture, therefore, not only models conditions
conducive to coral bleaching, but also reports when the coral is actually undergoing
physiological stress consistent with coral bleaching. Such output is of value not only to
coral researchers seeking to understand the environmental stressors and physiological
mechanisms associated with bleaching, but also to MPA managers who wish to directly
assess the status of a species of coral being monitored.
Deployment of a monitoring PAM fluorometer requires special consideration.
Since it is an optical instrument utilizing a light source, it needs to be frequently
cleaned because of the detrimental affect of biofouling organisms. Unfortunately, antifouling options are potentially harmful to the corals being monitored and, at the time of
this publication, a successful mechanism for the automated cleaning or protection of
optical interfaces has yet to be developed. Here again, high quality and intense in situ
monitoring requires an attentive station maintenance plan attuned to output from the
CREWS software and a regular station maintenance schedule. Fortunately, the lens
itself is a polycarbonate material and apparently has similar resistance to biofouling as
has been observed with Teflon™ coatings on irradiance sensors. These coatings exhibit
fairly low rates of biofouling because the non-porous material isn’t easily colonized, or
adhered to, by biofouling organisms in the marine environment.
In certain applications, the target corals may be some distance from the CREWS
station. However, utilization of the monitoring PAM fluorometer is still possible, with
communication to the tower achieved through use of acoustic modem technology
(Figure 10), currently under development at AOML. Acoustic modems transfer data
152
Hendee, Stabenau, Florit, Manzello and Jeffris