

Evidently, although strong relationships between a spectral variable and biomass have been found in various studies, transferring those predictive relationships
to different regions remains problematic (Foody et al. 2003).
3.3.2.3 Multiple Regression Models
Biomass estimates can be improved by combining satellite raw spectral bands,
spectral vegetation indices, and biophysically-related variables (Hall et al. 2006;
Zheng et al. 2004). These variables are usually integrated in multiple regression
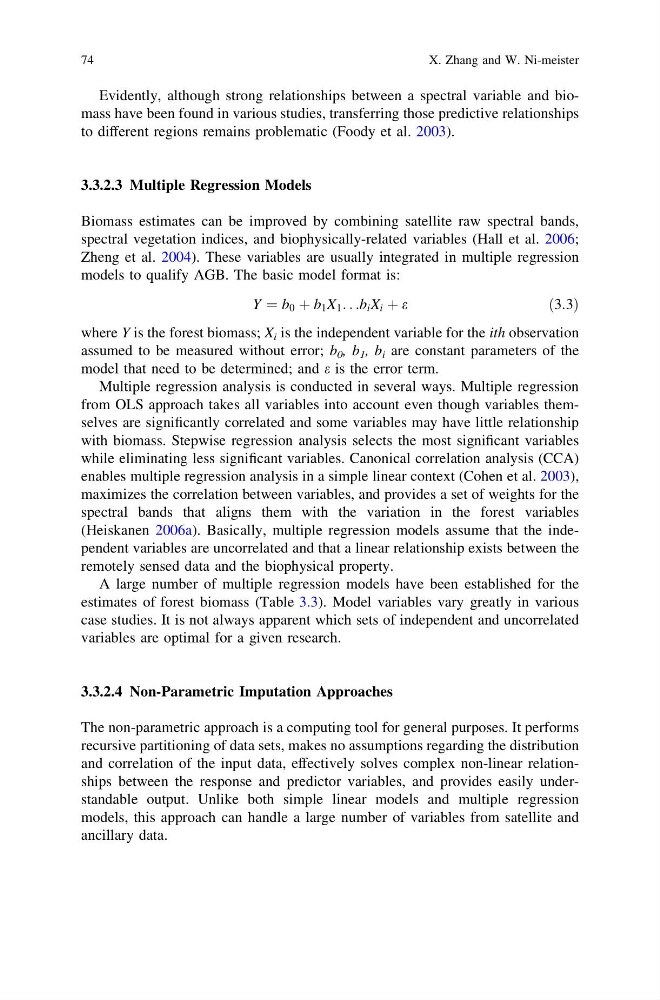
models to qualify AGB. The basic model format is:
Y ¼ b 0 þ b 1 X 1 . . .b i X i þ e
ð3:3Þ
where Y is the forest biomass; X i is the independent variable for the ith observation
assumed to be measured without error; b 0 , b 1 , b i are constant parameters of the
model that need to be determined; and e is the error term.
Multiple regression analysis is conducted in several ways. Multiple regression
from OLS approach takes all variables into account even though variables themselves are significantly correlated and some variables may have little relationship
with biomass. Stepwise regression analysis selects the most significant variables
while eliminating less significant variables. Canonical correlation analysis (CCA)
enables multiple regression analysis in a simple linear context (Cohen et al. 2003),
maximizes the correlation between variables, and provides a set of weights for the
spectral bands that aligns them with the variation in the forest variables
(Heiskanen 2006a). Basically, multiple regression models assume that the independent variables are uncorrelated and that a linear relationship exists between the
remotely sensed data and the biophysical property.
A large number of multiple regression models have been established for the
estimates of forest biomass (Table 3.3). Model variables vary greatly in various
case studies. It is not always apparent which sets of independent and uncorrelated
variables are optimal for a given research.
3.3.2.4 Non-Parametric Imputation Approaches
The non-parametric approach is a computing tool for general purposes. It performs
recursive partitioning of data sets, makes no assumptions regarding the distribution
and correlation of the input data, effectively solves complex non-linear relationships between the response and predictor variables, and provides easily understandable output. Unlike both simple linear models and multiple regression
models, this approach can handle a large number of variables from satellite and
ancillary data.
74
X. Zhang and W. Ni-meister
to different regions remains problematic (Foody et al. 2003).
3.3.2.3 Multiple Regression Models
Biomass estimates can be improved by combining satellite raw spectral bands,
spectral vegetation indices, and biophysically-related variables (Hall et al. 2006;
Zheng et al. 2004). These variables are usually integrated in multiple regression
models to qualify AGB. The basic model format is:
Y ¼ b 0 þ b 1 X 1 . . .b i X i þ e
ð3:3Þ
where Y is the forest biomass; X i is the independent variable for the ith observation
assumed to be measured without error; b 0 , b 1 , b i are constant parameters of the
model that need to be determined; and e is the error term.
Multiple regression analysis is conducted in several ways. Multiple regression
from OLS approach takes all variables into account even though variables themselves are significantly correlated and some variables may have little relationship
with biomass. Stepwise regression analysis selects the most significant variables
while eliminating less significant variables. Canonical correlation analysis (CCA)
enables multiple regression analysis in a simple linear context (Cohen et al. 2003),
maximizes the correlation between variables, and provides a set of weights for the
spectral bands that aligns them with the variation in the forest variables
(Heiskanen 2006a). Basically, multiple regression models assume that the independent variables are uncorrelated and that a linear relationship exists between the
remotely sensed data and the biophysical property.
A large number of multiple regression models have been established for the
estimates of forest biomass (Table 3.3). Model variables vary greatly in various
case studies. It is not always apparent which sets of independent and uncorrelated
variables are optimal for a given research.
3.3.2.4 Non-Parametric Imputation Approaches
The non-parametric approach is a computing tool for general purposes. It performs
recursive partitioning of data sets, makes no assumptions regarding the distribution
and correlation of the input data, effectively solves complex non-linear relationships between the response and predictor variables, and provides easily understandable output. Unlike both simple linear models and multiple regression
models, this approach can handle a large number of variables from satellite and
ancillary data.
74
X. Zhang and W. Ni-meister