

NASA’s Multi-angle Imaging SpectroRadiometer (MISR), GO model
retrieved distributions of crown cover and mean canopy height for forested
areas in New Mexico and Arizona (Chopping et al. 2008), which showed good
matches with data from US Forest Service (USFS) Interior West (FS-IW)
maps, with R
2 values of 0.78 and 0.69, and absolute mean errors of 0.10 and
2.2 m respectively.
Moreover, forest canopy structure can also be derived from multiangle
reflectance data using empirical methods and physical or semi-empirical
models (Nolin 2004; Chopping et al. 2012). Specifically, a neural network was
used to derive canopy height estimates (R
2 = *0.9) from the Airborne MISR
(AirMISR) after trained by height data from the NASA Laser Vegetation
Imaging Sensor (LVIS, a waveform lidar) (Kimes et al. 2006), and from MISR
data at 275 m and 1.1 km resolutions after trained and assessed by highresolution biotope inventory data, where the tree cover estimates had a RMSE
of 6.5 % (relative RMSE 56.1 %) at 275 m resolution and of 4.1 % (36.9 %)
at 1.1 km resolution, and the tree height estimates had a RMSE of 2.0 m
(37.6 %) and 1.3 m (25.4 %), respectively (Heiskanen 2006a, b). Moreover,
the multivariate linear regression models were developed to estimate LVIS
height measures from 28 AirMISR multi-angle spectral reflectances and from
the spectrally invariant escape probability at 7 AirMISR view angles (Schull
et al. 2007).
(3) Tree shadow fraction (SF) is defined as the sum of individual tree shadow (TS)
areas divided by a ground reference area. Individual TS is composed of both
shadowed crown and crown shadow cast on the ground (Li and Strahler 1985).
Although it is not a physical attribute of forests, the SF is a suitable variable
for estimating forest biomass, LAI, and chlorophyll concentration (Greenberg
et al. 2005; Peddle et al. 2001). Besides using canopy reflectance model, SF
can also be inferred from medium resolution spectral images (e.g. ETM/
ETM+) using spectral unmixing models (Hall et al. 1995; Peddle et al. 1995;
Peddle and Johnson 2000). For the HRSI data, TS in a given local or plot area
can be calculated by applying a threshold to the digital values of individual
pixels (Leboeuf et al. 2007).
3.3.2.2 Simple Models of Biomass Estimates
Forest biomass models in a local area can be produced by comparing single
vegetation index or spectral reflectance with samples of field biomass measurements (Roy and Ravan 1996; Calvao and Palmeririm 2004; Salvador and pons
1998; Steininger 2000; Heiskanen 2006a, b). The frequently used empirical model
format is:
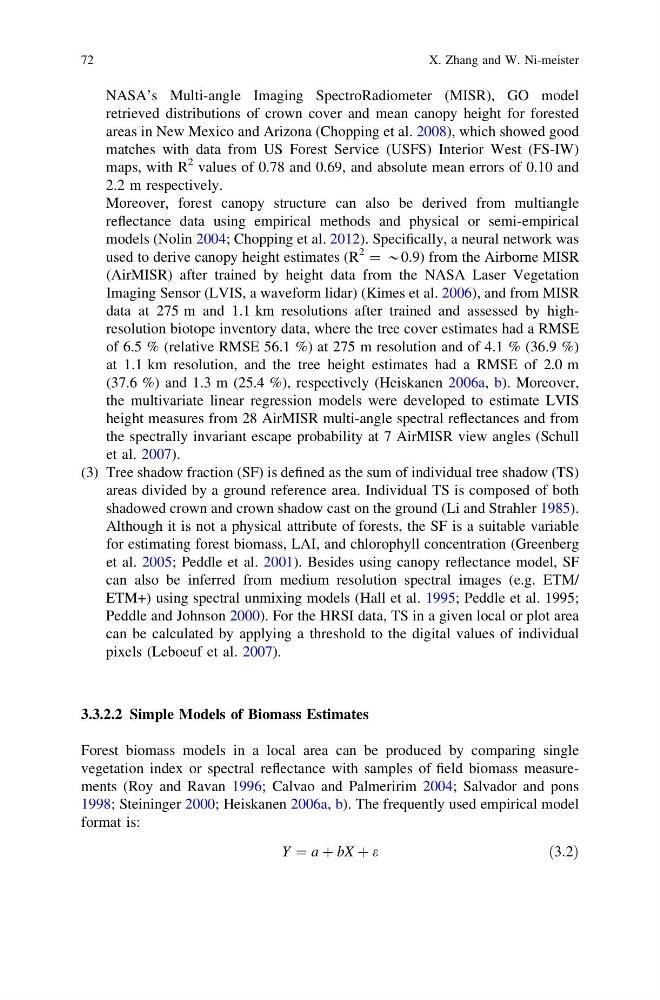
Y ¼ a þ bX þ e
ð3:2Þ
72
X. Zhang and W. Ni-meister
retrieved distributions of crown cover and mean canopy height for forested
areas in New Mexico and Arizona (Chopping et al. 2008), which showed good
matches with data from US Forest Service (USFS) Interior West (FS-IW)
maps, with R
2 values of 0.78 and 0.69, and absolute mean errors of 0.10 and
2.2 m respectively.
Moreover, forest canopy structure can also be derived from multiangle
reflectance data using empirical methods and physical or semi-empirical
models (Nolin 2004; Chopping et al. 2012). Specifically, a neural network was
used to derive canopy height estimates (R
2 = *0.9) from the Airborne MISR
(AirMISR) after trained by height data from the NASA Laser Vegetation
Imaging Sensor (LVIS, a waveform lidar) (Kimes et al. 2006), and from MISR
data at 275 m and 1.1 km resolutions after trained and assessed by highresolution biotope inventory data, where the tree cover estimates had a RMSE
of 6.5 % (relative RMSE 56.1 %) at 275 m resolution and of 4.1 % (36.9 %)
at 1.1 km resolution, and the tree height estimates had a RMSE of 2.0 m
(37.6 %) and 1.3 m (25.4 %), respectively (Heiskanen 2006a, b). Moreover,
the multivariate linear regression models were developed to estimate LVIS
height measures from 28 AirMISR multi-angle spectral reflectances and from
the spectrally invariant escape probability at 7 AirMISR view angles (Schull
et al. 2007).
(3) Tree shadow fraction (SF) is defined as the sum of individual tree shadow (TS)
areas divided by a ground reference area. Individual TS is composed of both
shadowed crown and crown shadow cast on the ground (Li and Strahler 1985).
Although it is not a physical attribute of forests, the SF is a suitable variable
for estimating forest biomass, LAI, and chlorophyll concentration (Greenberg
et al. 2005; Peddle et al. 2001). Besides using canopy reflectance model, SF
can also be inferred from medium resolution spectral images (e.g. ETM/
ETM+) using spectral unmixing models (Hall et al. 1995; Peddle et al. 1995;
Peddle and Johnson 2000). For the HRSI data, TS in a given local or plot area
can be calculated by applying a threshold to the digital values of individual
pixels (Leboeuf et al. 2007).
3.3.2.2 Simple Models of Biomass Estimates
Forest biomass models in a local area can be produced by comparing single
vegetation index or spectral reflectance with samples of field biomass measurements (Roy and Ravan 1996; Calvao and Palmeririm 2004; Salvador and pons
1998; Steininger 2000; Heiskanen 2006a, b). The frequently used empirical model
format is:
Y ¼ a þ bX þ e
ð3:2Þ
72
X. Zhang and W. Ni-meister