

3.3.2.1 Satellite-Derived Variables for Biomass Estimates
Several passive optical satellite instruments are available for determining the
spatial coverage of biomass. NOAA Advanced Very High Resolution Radiometer
(VAHRR) and Moderate Resolution Imaging Spectroradiometer (MODIS) data at a
spatial resolution from 250 m to 1,000 m are frequently used to produce biomass
estimates at long term and global scales (Dong et al. 2003; Baccini et al. 2004,
2008; Zhang and Kondragunta 2006). Landsat Thematic Mapper (TM), Enhanced
Thematic Mapper Plus (ETM+), and Advanced Spaceborne Thermal Emission and
Reflection Radiometer (ASTER) with a spatial resolution of 30 m are the most
frequently used data to quantify biomass at local and regional scales (e.g., Fazakas
et al. 1999; Häme et al. 1997; Krankina et al. 2004; Tomppo et al. 2002; Turner
et al. 2004; Muukkonen and Heiskanen 2005). Local tree biomass is usually calculated from high-resolution satellite imagery (HRSI) on QuickBird and IKONOS
(Leboeuf et al. 2007; Gonzalez, et al. 2010; Palace et al. 2008). The IKONOS has a
spatial resolution of 3.2 m in multispectral and 0.82 m in panchromatic at nadir
while QuickBird has a resolution of 2.44 and 0.61 m, separately.
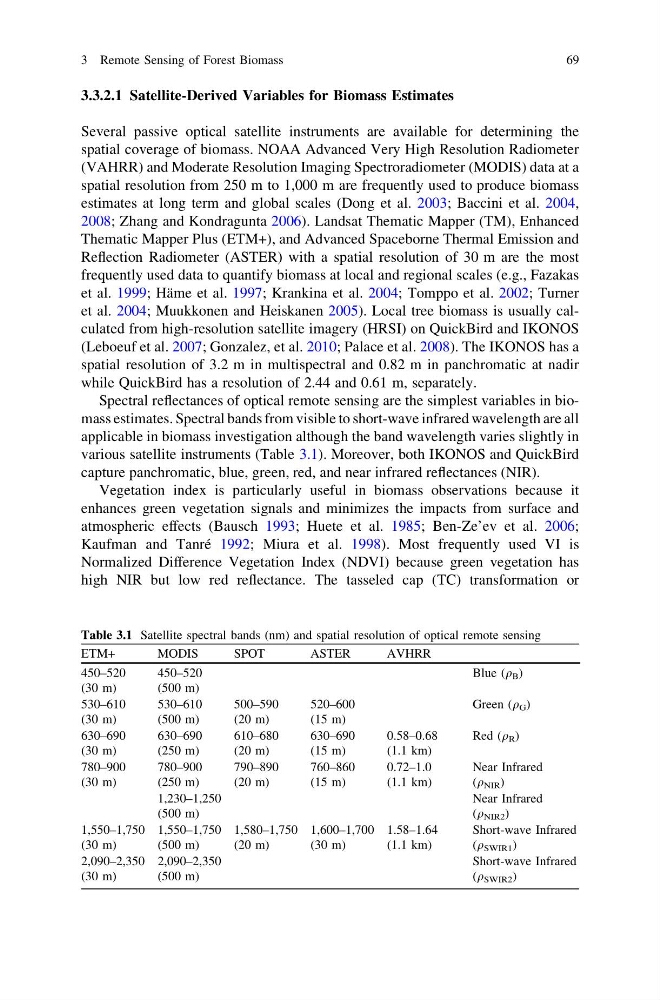
Spectral reflectances of optical remote sensing are the simplest variables in biomass estimates. Spectral bands from visible to short-wave infrared wavelength are all
applicable in biomass investigation although the band wavelength varies slightly in
various satellite instruments (Table 3.1). Moreover, both IKONOS and QuickBird
capture panchromatic, blue, green, red, and near infrared reflectances (NIR).
Vegetation index is particularly useful in biomass observations because it
enhances green vegetation signals and minimizes the impacts from surface and
atmospheric effects (Bausch 1993; Huete et al. 1985; Ben-Ze’ev et al. 2006;
Kaufman and Tanré 1992; Miura et al. 1998). Most frequently used VI is
Normalized Difference Vegetation Index (NDVI) because green vegetation has
high NIR but low red reflectance. The tasseled cap (TC) transformation or
Table 3.1 Satellite spectral bands (nm) and spatial resolution of optical remote sensing
ETM+
MODIS
SPOT
ASTER
AVHRR
450–520
(30 m)
450–520
(500 m)
Blue (q B )
530–610
(30 m)
530–610
(500 m)
500–590
(20 m)
520–600
(15 m)
Green (q G )
630–690
(30 m)
630–690
(250 m)
610–680
(20 m)
630–690
(15 m)
0.58–0.68
(1.1 km)
Red (q R )
780–900
(30 m)
780–900
(250 m)
790–890
(20 m)
760–860
(15 m)
0.72–1.0
(1.1 km)
Near Infrared
(q NIR )
1,230–1,250
(500 m)
Near Infrared
(q NIR2 )
1,550–1,750
(30 m)
1,550–1,750
(500 m)
1,580–1,750
(20 m)
1,600–1,700
(30 m)
1.58–1.64
(1.1 km)
Short-wave Infrared
(q SWIR1 )
2,090–2,350
(30 m)
2,090–2,350
(500 m)
Short-wave Infrared
(q SWIR2 )
3 Remote Sensing of Forest Biomass
69
Several passive optical satellite instruments are available for determining the
spatial coverage of biomass. NOAA Advanced Very High Resolution Radiometer
(VAHRR) and Moderate Resolution Imaging Spectroradiometer (MODIS) data at a
spatial resolution from 250 m to 1,000 m are frequently used to produce biomass
estimates at long term and global scales (Dong et al. 2003; Baccini et al. 2004,
2008; Zhang and Kondragunta 2006). Landsat Thematic Mapper (TM), Enhanced
Thematic Mapper Plus (ETM+), and Advanced Spaceborne Thermal Emission and
Reflection Radiometer (ASTER) with a spatial resolution of 30 m are the most
frequently used data to quantify biomass at local and regional scales (e.g., Fazakas
et al. 1999; Häme et al. 1997; Krankina et al. 2004; Tomppo et al. 2002; Turner
et al. 2004; Muukkonen and Heiskanen 2005). Local tree biomass is usually calculated from high-resolution satellite imagery (HRSI) on QuickBird and IKONOS
(Leboeuf et al. 2007; Gonzalez, et al. 2010; Palace et al. 2008). The IKONOS has a
spatial resolution of 3.2 m in multispectral and 0.82 m in panchromatic at nadir
while QuickBird has a resolution of 2.44 and 0.61 m, separately.
Spectral reflectances of optical remote sensing are the simplest variables in biomass estimates. Spectral bands from visible to short-wave infrared wavelength are all
applicable in biomass investigation although the band wavelength varies slightly in
various satellite instruments (Table 3.1). Moreover, both IKONOS and QuickBird
capture panchromatic, blue, green, red, and near infrared reflectances (NIR).
Vegetation index is particularly useful in biomass observations because it
enhances green vegetation signals and minimizes the impacts from surface and
atmospheric effects (Bausch 1993; Huete et al. 1985; Ben-Ze’ev et al. 2006;
Kaufman and Tanré 1992; Miura et al. 1998). Most frequently used VI is
Normalized Difference Vegetation Index (NDVI) because green vegetation has
high NIR but low red reflectance. The tasseled cap (TC) transformation or
Table 3.1 Satellite spectral bands (nm) and spatial resolution of optical remote sensing
ETM+
MODIS
SPOT
ASTER
AVHRR
450–520
(30 m)
450–520
(500 m)
Blue (q B )
530–610
(30 m)
530–610
(500 m)
500–590
(20 m)
520–600
(15 m)
Green (q G )
630–690
(30 m)
630–690
(250 m)
610–680
(20 m)
630–690
(15 m)
0.58–0.68
(1.1 km)
Red (q R )
780–900
(30 m)
780–900
(250 m)
790–890
(20 m)
760–860
(15 m)
0.72–1.0
(1.1 km)
Near Infrared
(q NIR )
1,230–1,250
(500 m)
Near Infrared
(q NIR2 )
1,550–1,750
(30 m)
1,550–1,750
(500 m)
1,580–1,750
(20 m)
1,600–1,700
(30 m)
1.58–1.64
(1.1 km)
Short-wave Infrared
(q SWIR1 )
2,090–2,350
(30 m)
2,090–2,350
(500 m)
Short-wave Infrared
(q SWIR2 )
3 Remote Sensing of Forest Biomass
69