

Taking another step forward, CAFE NPP can be partitioned amongst various
phytoplankton groups. This step can be achieved in many ways (e.g., Uitz et al.
2010). Here, the model of Kostadinov et al. (2009, 2010) has been used which
links satellite-derived particulate backscattering to the particle size distribution. In
this example, the fraction of total particle biovolume in each of three size-based
phytoplankton groups (pico-, nano-, micro-) has been estimated and directly
assigned to the fraction of NPP in each group. Ideally, this partitioning of particle
volume (a proxy for biomass) would occur first and NPP would then be calculated
in parallel for each group. Further, Chl could be partitioned in a similar manner
(e.g., Uitz et al. 2006) and allow group specific Chl:C for use in the CAFE model.
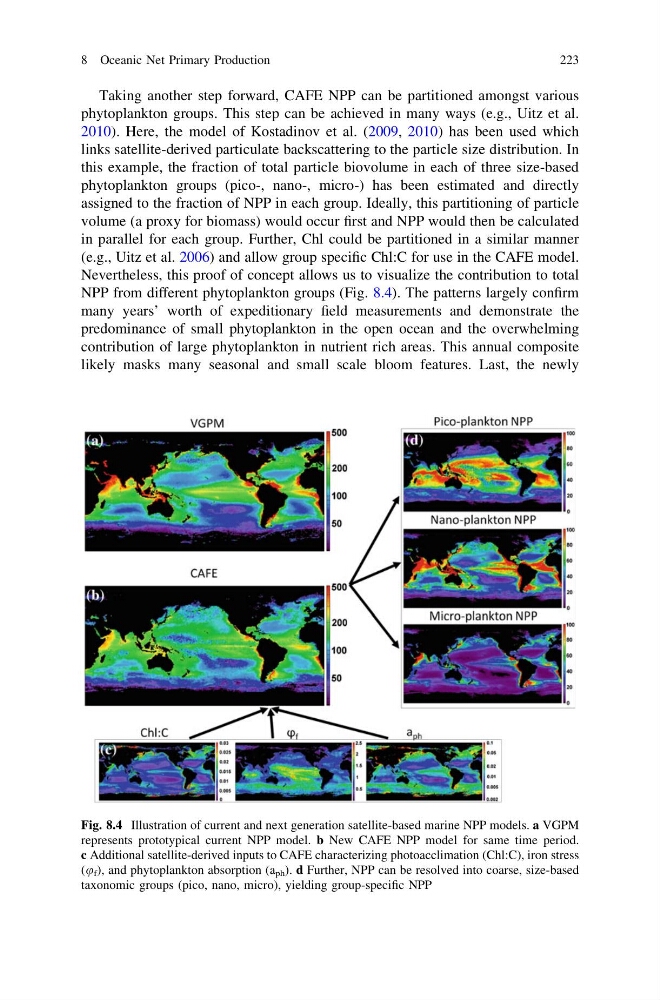
Nevertheless, this proof of concept allows us to visualize the contribution to total
NPP from different phytoplankton groups (Fig. 8.4). The patterns largely confirm
many years’ worth of expeditionary field measurements and demonstrate the
predominance of small phytoplankton in the open ocean and the overwhelming
contribution of large phytoplankton in nutrient rich areas. This annual composite
likely masks many seasonal and small scale bloom features. Last, the newly
Fig. 8.4 Illustration of current and next generation satellite-based marine NPP models. a VGPM
represents prototypical current NPP model. b New CAFE NPP model for same time period.
c Additional satellite-derived inputs to CAFE characterizing photoacclimation (Chl:C), iron stress
(u f ), and phytoplankton absorption (a ph ). d Further, NPP can be resolved into coarse, size-based
taxonomic groups (pico, nano, micro), yielding group-specific NPP
8 Oceanic Net Primary Production
223
phytoplankton groups. This step can be achieved in many ways (e.g., Uitz et al.
2010). Here, the model of Kostadinov et al. (2009, 2010) has been used which
links satellite-derived particulate backscattering to the particle size distribution. In
this example, the fraction of total particle biovolume in each of three size-based
phytoplankton groups (pico-, nano-, micro-) has been estimated and directly
assigned to the fraction of NPP in each group. Ideally, this partitioning of particle
volume (a proxy for biomass) would occur first and NPP would then be calculated
in parallel for each group. Further, Chl could be partitioned in a similar manner
(e.g., Uitz et al. 2006) and allow group specific Chl:C for use in the CAFE model.
Nevertheless, this proof of concept allows us to visualize the contribution to total
NPP from different phytoplankton groups (Fig. 8.4). The patterns largely confirm
many years’ worth of expeditionary field measurements and demonstrate the
predominance of small phytoplankton in the open ocean and the overwhelming
contribution of large phytoplankton in nutrient rich areas. This annual composite
likely masks many seasonal and small scale bloom features. Last, the newly
Fig. 8.4 Illustration of current and next generation satellite-based marine NPP models. a VGPM
represents prototypical current NPP model. b New CAFE NPP model for same time period.
c Additional satellite-derived inputs to CAFE characterizing photoacclimation (Chl:C), iron stress
(u f ), and phytoplankton absorption (a ph ). d Further, NPP can be resolved into coarse, size-based
taxonomic groups (pico, nano, micro), yielding group-specific NPP
8 Oceanic Net Primary Production
223