

global estimates of marine NPP from the VGPM and terrestrial NPP from the
CASA model (Potter et al. 1993). Although state-of-the-art at the time, the averaging periods for land and oceans were significantly different, the spatial resolutions were coarse, and quality for the ocean color data was well below today’s
standards. Nevertheless, the global picture that emerged indicated a marine NPP
contribution of *49 Pg C of the combined 105 Pg C for the biosphere. Compilation of historical estimates of oceanic NPP based on
14 C measurements yields a
mean value similar to the Field et al. (1998) satellite-based estimate, but uncertainty in the field-based assessment is large enough to render the estimate meaningless (see Barber and Hilting 2002 for a chronology of global NPP estimates).
Recalculation of biospheric NPP using more recent data than employed by
Field et al. (1998) yields values for a typical year (2004) of 54 and 50 Pg C year
-1
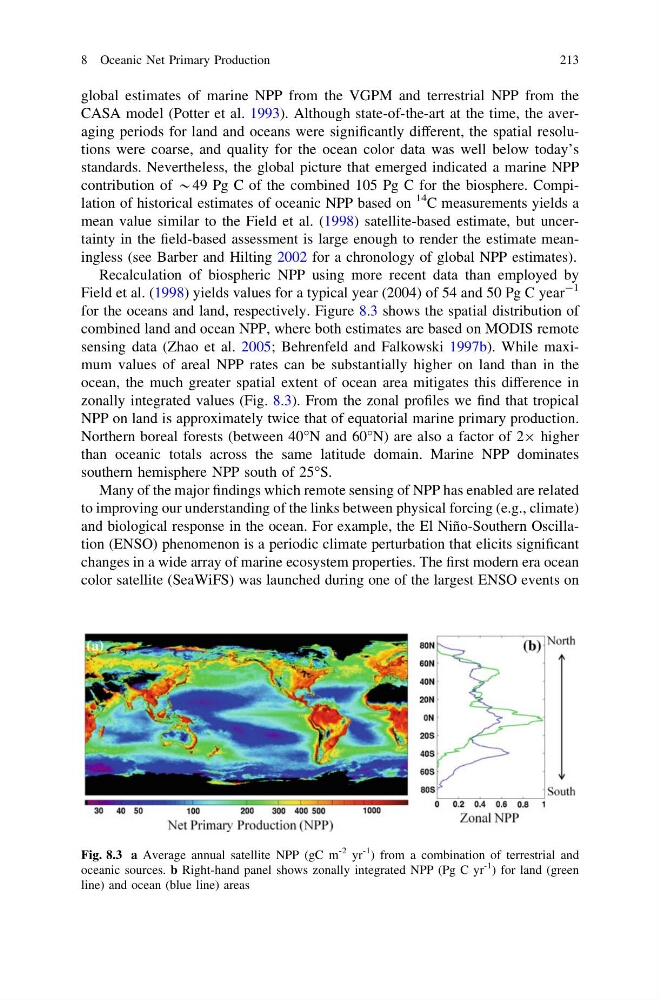
for the oceans and land, respectively. Figure 8.3 shows the spatial distribution of
combined land and ocean NPP, where both estimates are based on MODIS remote
sensing data (Zhao et al. 2005; Behrenfeld and Falkowski 1997b). While maximum values of areal NPP rates can be substantially higher on land than in the
ocean, the much greater spatial extent of ocean area mitigates this difference in
zonally integrated values (Fig. 8.3). From the zonal profiles we find that tropical
NPP on land is approximately twice that of equatorial marine primary production.
Northern boreal forests (between 40°N and 60°N) are also a factor of 29 higher
than oceanic totals across the same latitude domain. Marine NPP dominates
southern hemisphere NPP south of 25°S.
Many of the major findings which remote sensing of NPP has enabled are related
to improving our understanding of the links between physical forcing (e.g., climate)
and biological response in the ocean. For example, the El Niño-Southern Oscillation (ENSO) phenomenon is a periodic climate perturbation that elicits significant
changes in a wide array of marine ecosystem properties. The first modern era ocean
color satellite (SeaWiFS) was launched during one of the largest ENSO events on
Fig. 8.3 a Average annual satellite NPP (gC m
-2 yr
-1
) from a combination of terrestrial and
oceanic sources. b Right-hand panel shows zonally integrated NPP (Pg C yr
-1 ) for land (green
line) and ocean (blue line) areas
8 Oceanic Net Primary Production
213
CASA model (Potter et al. 1993). Although state-of-the-art at the time, the averaging periods for land and oceans were significantly different, the spatial resolutions were coarse, and quality for the ocean color data was well below today’s
standards. Nevertheless, the global picture that emerged indicated a marine NPP
contribution of *49 Pg C of the combined 105 Pg C for the biosphere. Compilation of historical estimates of oceanic NPP based on
14 C measurements yields a
mean value similar to the Field et al. (1998) satellite-based estimate, but uncertainty in the field-based assessment is large enough to render the estimate meaningless (see Barber and Hilting 2002 for a chronology of global NPP estimates).
Recalculation of biospheric NPP using more recent data than employed by
Field et al. (1998) yields values for a typical year (2004) of 54 and 50 Pg C year
-1
for the oceans and land, respectively. Figure 8.3 shows the spatial distribution of
combined land and ocean NPP, where both estimates are based on MODIS remote
sensing data (Zhao et al. 2005; Behrenfeld and Falkowski 1997b). While maximum values of areal NPP rates can be substantially higher on land than in the
ocean, the much greater spatial extent of ocean area mitigates this difference in
zonally integrated values (Fig. 8.3). From the zonal profiles we find that tropical
NPP on land is approximately twice that of equatorial marine primary production.
Northern boreal forests (between 40°N and 60°N) are also a factor of 29 higher
than oceanic totals across the same latitude domain. Marine NPP dominates
southern hemisphere NPP south of 25°S.
Many of the major findings which remote sensing of NPP has enabled are related
to improving our understanding of the links between physical forcing (e.g., climate)
and biological response in the ocean. For example, the El Niño-Southern Oscillation (ENSO) phenomenon is a periodic climate perturbation that elicits significant
changes in a wide array of marine ecosystem properties. The first modern era ocean
color satellite (SeaWiFS) was launched during one of the largest ENSO events on
Fig. 8.3 a Average annual satellite NPP (gC m
-2 yr
-1
) from a combination of terrestrial and
oceanic sources. b Right-hand panel shows zonally integrated NPP (Pg C yr
-1 ) for land (green
line) and ocean (blue line) areas
8 Oceanic Net Primary Production
213