

calculation of mean assimilation efficiencies. Behrenfeld and Falkowski (1997b)
introduced an alternative temperature-dependent function that has also been
widely applied. In their relationship, assimilation efficiency increases approximately exponentially up to 20 °C and then decreases, with a Q 10 for the lower
temperature range being similar to that of the ‘Eppley curve’. The Behrenfeld and
Falkowski relationship was empirically derived from field
14 C data and the downturn in efficiencies at [20 °C was interpreted to reflect effects of nutrient stress. It
is now recognized that nutrient stress, in and of itself, is not synonymous with a
reduction in photosynthetic efficiency (Halsey et al. 2010; Parkhill et al. 2001).
Thus, there is also no clear physiological basis for the temperature-dependent
function of Behrenfeld and Falkowski (1997b).
Development of new approaches for characterizing spatial-temporal variability
in phytoplankton assimilation efficiencies is essential to advancing global ocean
NPP estimates if surface chlorophyll concentration continues to be the remotely
detected property of choice for phytoplankton biomass. Clearly, these advances
must be based on a fundamental understanding of physiological responses to
environmental growth conditions, rather than empirical relationships with SST.
Nevertheless, employment of simple SST functions has yielded NPP estimates that
exhibit reasonable relationships with field measured values. So, what is the basis of
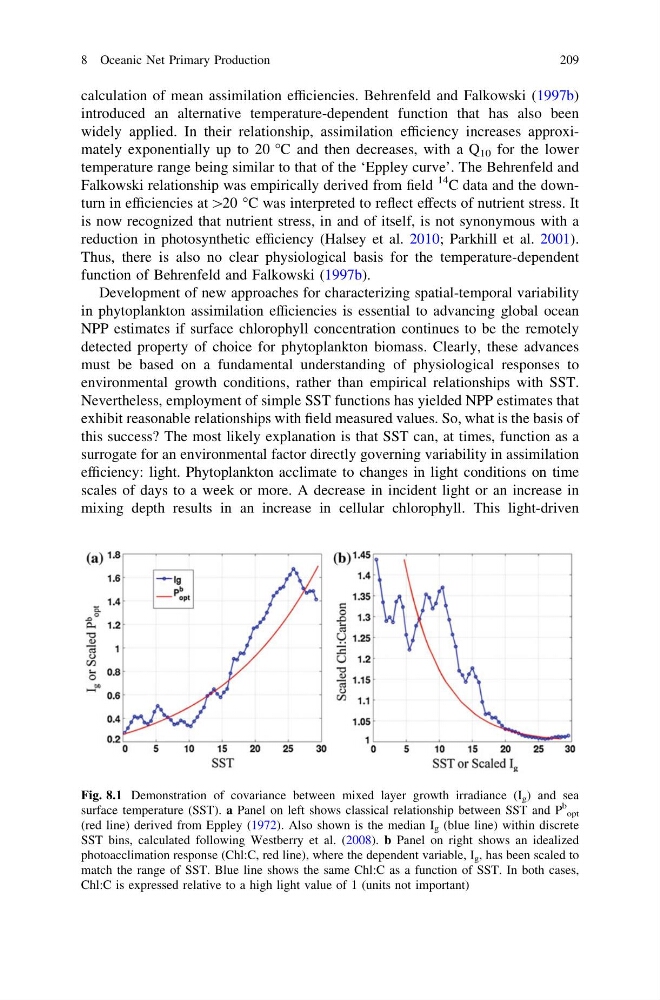
this success? The most likely explanation is that SST can, at times, function as a
surrogate for an environmental factor directly governing variability in assimilation
efficiency: light. Phytoplankton acclimate to changes in light conditions on time
scales of days to a week or more. A decrease in incident light or an increase in
mixing depth results in an increase in cellular chlorophyll. This light-driven
Fig. 8.1 Demonstration of covariance between mixed layer growth irradiance (I g ) and sea
surface temperature (SST). a Panel on left shows classical relationship between SST and P
b
opt
(red line) derived from Eppley (1972). Also shown is the median I g (blue line) within discrete
SST bins, calculated following Westberry et al. (2008). b Panel on right shows an idealized
photoacclimation response (Chl:C, red line), where the dependent variable, I g , has been scaled to
match the range of SST. Blue line shows the same Chl:C as a function of SST. In both cases,
Chl:C is expressed relative to a high light value of 1 (units not important)
8 Oceanic Net Primary Production
209
introduced an alternative temperature-dependent function that has also been
widely applied. In their relationship, assimilation efficiency increases approximately exponentially up to 20 °C and then decreases, with a Q 10 for the lower
temperature range being similar to that of the ‘Eppley curve’. The Behrenfeld and
Falkowski relationship was empirically derived from field
14 C data and the downturn in efficiencies at [20 °C was interpreted to reflect effects of nutrient stress. It
is now recognized that nutrient stress, in and of itself, is not synonymous with a
reduction in photosynthetic efficiency (Halsey et al. 2010; Parkhill et al. 2001).
Thus, there is also no clear physiological basis for the temperature-dependent
function of Behrenfeld and Falkowski (1997b).
Development of new approaches for characterizing spatial-temporal variability
in phytoplankton assimilation efficiencies is essential to advancing global ocean
NPP estimates if surface chlorophyll concentration continues to be the remotely
detected property of choice for phytoplankton biomass. Clearly, these advances
must be based on a fundamental understanding of physiological responses to
environmental growth conditions, rather than empirical relationships with SST.
Nevertheless, employment of simple SST functions has yielded NPP estimates that
exhibit reasonable relationships with field measured values. So, what is the basis of
this success? The most likely explanation is that SST can, at times, function as a
surrogate for an environmental factor directly governing variability in assimilation
efficiency: light. Phytoplankton acclimate to changes in light conditions on time
scales of days to a week or more. A decrease in incident light or an increase in
mixing depth results in an increase in cellular chlorophyll. This light-driven
Fig. 8.1 Demonstration of covariance between mixed layer growth irradiance (I g ) and sea
surface temperature (SST). a Panel on left shows classical relationship between SST and P
b
opt
(red line) derived from Eppley (1972). Also shown is the median I g (blue line) within discrete
SST bins, calculated following Westberry et al. (2008). b Panel on right shows an idealized
photoacclimation response (Chl:C, red line), where the dependent variable, I g , has been scaled to
match the range of SST. Blue line shows the same Chl:C as a function of SST. In both cases,
Chl:C is expressed relative to a high light value of 1 (units not important)
8 Oceanic Net Primary Production
209