

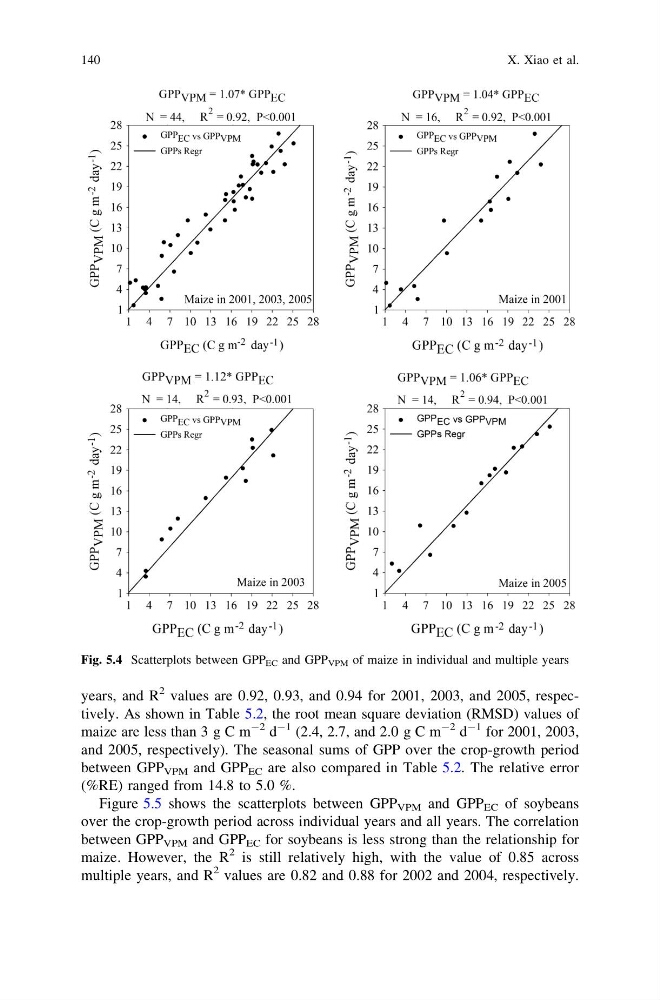
years, and R
2 values are 0.92, 0.93, and 0.94 for 2001, 2003, and 2005, respectively. As shown in Table 5.2, the root mean square deviation (RMSD) values of
maize are less than 3 g C m
-2 d
-1 (2.4, 2.7, and 2.0 g C m
-2 d
-1 for 2001, 2003,
and 2005, respectively). The seasonal sums of GPP over the crop-growth period
between GPP VPM and GPP EC are also compared in Table 5.2. The relative error
(%RE) ranged from 14.8 to 5.0 %.
Figure 5.5 shows the scatterplots between GPP VPM and GPP EC of soybeans
over the crop-growth period across individual years and all years. The correlation
between GPP VPM and GPP EC for soybeans is less strong than the relationship for
maize. However, the R
2 is still relatively high, with the value of 0.85 across
multiple years, and R
2 values are 0.82 and 0.88 for 2002 and 2004, respectively.
Fig. 5.4 Scatterplots between GPP EC and GPP VPM of maize in individual and multiple years
140
X. Xiao et al.
2 values are 0.92, 0.93, and 0.94 for 2001, 2003, and 2005, respectively. As shown in Table 5.2, the root mean square deviation (RMSD) values of
maize are less than 3 g C m
-2 d
-1 (2.4, 2.7, and 2.0 g C m
-2 d
-1 for 2001, 2003,
and 2005, respectively). The seasonal sums of GPP over the crop-growth period
between GPP VPM and GPP EC are also compared in Table 5.2. The relative error
(%RE) ranged from 14.8 to 5.0 %.
Figure 5.5 shows the scatterplots between GPP VPM and GPP EC of soybeans
over the crop-growth period across individual years and all years. The correlation
between GPP VPM and GPP EC for soybeans is less strong than the relationship for
maize. However, the R
2 is still relatively high, with the value of 0.85 across
multiple years, and R
2 values are 0.82 and 0.88 for 2002 and 2004, respectively.
Fig. 5.4 Scatterplots between GPP EC and GPP VPM of maize in individual and multiple years
140
X. Xiao et al.