

numbers that provide an indication of how much radiation is reflected. The digital
numbers from multiple areal units (or pixels) are used to create images that display
the reflection of radiation from the land surface (Shellito 2012).
The surface characteristics of the Earth primarily determine the amounts of
visible light and NIR that are reflected and captured by the sensors mounted on
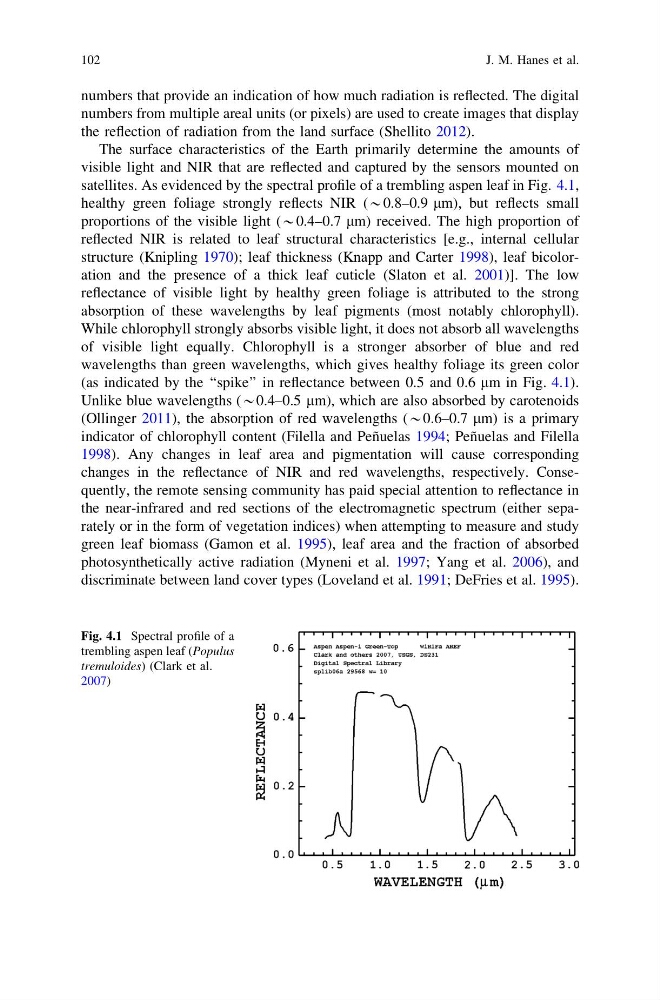
satellites. As evidenced by the spectral profile of a trembling aspen leaf in Fig. 4.1,
healthy green foliage strongly reflects NIR (*0.8–0.9 lm), but reflects small
proportions of the visible light (*0.4–0.7 lm) received. The high proportion of
reflected NIR is related to leaf structural characteristics [e.g., internal cellular
structure (Knipling 1970); leaf thickness (Knapp and Carter 1998), leaf bicoloration and the presence of a thick leaf cuticle (Slaton et al. 2001)]. The low
reflectance of visible light by healthy green foliage is attributed to the strong
absorption of these wavelengths by leaf pigments (most notably chlorophyll).
While chlorophyll strongly absorbs visible light, it does not absorb all wavelengths
of visible light equally. Chlorophyll is a stronger absorber of blue and red
wavelengths than green wavelengths, which gives healthy foliage its green color
(as indicated by the ‘‘spike’’ in reflectance between 0.5 and 0.6 lm in Fig. 4.1).
Unlike blue wavelengths (*0.4–0.5 lm), which are also absorbed by carotenoids
(Ollinger 2011), the absorption of red wavelengths (*0.6–0.7 lm) is a primary
indicator of chlorophyll content (Filella and Peñuelas 1994; Peñuelas and Filella
1998). Any changes in leaf area and pigmentation will cause corresponding
changes in the reflectance of NIR and red wavelengths, respectively. Consequently, the remote sensing community has paid special attention to reflectance in
the near-infrared and red sections of the electromagnetic spectrum (either separately or in the form of vegetation indices) when attempting to measure and study
green leaf biomass (Gamon et al. 1995), leaf area and the fraction of absorbed
photosynthetically active radiation (Myneni et al. 1997; Yang et al. 2006), and
discriminate between land cover types (Loveland et al. 1991; DeFries et al. 1995).
Fig. 4.1 Spectral profile of a
trembling aspen leaf (Populus
tremuloides) (Clark et al.
2007)
102
J. M. Hanes et al.
numbers from multiple areal units (or pixels) are used to create images that display
the reflection of radiation from the land surface (Shellito 2012).
The surface characteristics of the Earth primarily determine the amounts of
visible light and NIR that are reflected and captured by the sensors mounted on
satellites. As evidenced by the spectral profile of a trembling aspen leaf in Fig. 4.1,
healthy green foliage strongly reflects NIR (*0.8–0.9 lm), but reflects small
proportions of the visible light (*0.4–0.7 lm) received. The high proportion of
reflected NIR is related to leaf structural characteristics [e.g., internal cellular
structure (Knipling 1970); leaf thickness (Knapp and Carter 1998), leaf bicoloration and the presence of a thick leaf cuticle (Slaton et al. 2001)]. The low
reflectance of visible light by healthy green foliage is attributed to the strong
absorption of these wavelengths by leaf pigments (most notably chlorophyll).
While chlorophyll strongly absorbs visible light, it does not absorb all wavelengths
of visible light equally. Chlorophyll is a stronger absorber of blue and red
wavelengths than green wavelengths, which gives healthy foliage its green color
(as indicated by the ‘‘spike’’ in reflectance between 0.5 and 0.6 lm in Fig. 4.1).
Unlike blue wavelengths (*0.4–0.5 lm), which are also absorbed by carotenoids
(Ollinger 2011), the absorption of red wavelengths (*0.6–0.7 lm) is a primary
indicator of chlorophyll content (Filella and Peñuelas 1994; Peñuelas and Filella
1998). Any changes in leaf area and pigmentation will cause corresponding
changes in the reflectance of NIR and red wavelengths, respectively. Consequently, the remote sensing community has paid special attention to reflectance in
the near-infrared and red sections of the electromagnetic spectrum (either separately or in the form of vegetation indices) when attempting to measure and study
green leaf biomass (Gamon et al. 1995), leaf area and the fraction of absorbed
photosynthetically active radiation (Myneni et al. 1997; Yang et al. 2006), and
discriminate between land cover types (Loveland et al. 1991; DeFries et al. 1995).
Fig. 4.1 Spectral profile of a
trembling aspen leaf (Populus
tremuloides) (Clark et al.
2007)
102
J. M. Hanes et al.