

3. To prepare tables of the fine structure parameters for every component (if there is
not in file). To prepare data files with computer program “V_contur” (separate
file for every component), containing values of frequencies n
ðiÞ
0 , intensities S
ðiÞ ,
halfwidths a
ðiÞ and energy of lowest energy E
i . Every file has to contain the
information of one gaseous component. Data input strictly in ascending order of
wave numbers n
ðiÞ
0 . File names are to be composed in accordance with
instructions below.
4. To plot the absorption line intensity for every component as a straight vertical
line. On the abscissa OX values of wave number and on the ordinate OY
intensities of absorption lines in logarithmic scale are plotted (the scale of the
axes OX is to be similar). Plotting might be done in EXCEL editor.
5. To study the character of the pressure and temperature impact to:
– the intensity and halfwidth of absorption line;
– the spectral variations of the absorption coefficient.
The study is accomplished with the computer program “CONTUR_1.exe”, that
realizes the calculation of the absorption coefficient of the single absorption line.
Only Lorenz’s contour is considered.
6. To calculate the spectral dependence of every gaseous component absorption
coefficient with the program “CONTUR_2.exe”, the file of aerological sounding
data and sequentially pointing file names of every component.
Calculation is accomplished separately for 3–4 temperature values and pressure
in atmospheric layers
– 1,000 Ä 700 GPa,
– 700 Ä 300 GPa,
– 300 Ä p min GPa.
Positions of corresponding levels input with pointing numbers in tables of
aerological sounding. The table is output to the screen after every running of
the program “CONTUR_2.exe”. In every case, the resulting plot of the spectral
absorption coefficient is written to a file “contour2.dat”. All obtained results are
to be plotted and included to the final report.
7. To calculate the vertical profile of the absorption coefficient of every component
with the program “Contur_3” and file of aerological sounding data for 3 wave
numbers (for strong, moderate and weak absorption).
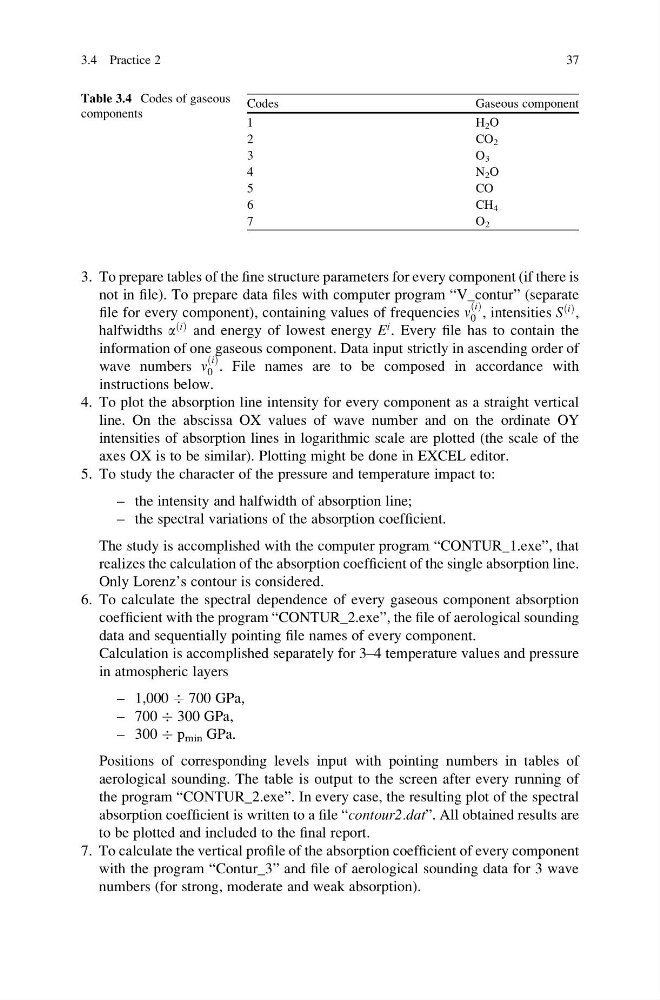
Table 3.4 Codes of gaseous
components
Codes
Gaseous component
1
H 2 O
2
C O 2
3
O 3
4
N 2 O
5
C O
6
C H 4
7
O 2
3.4 Practice 2
37
not in file). To prepare data files with computer program “V_contur” (separate
file for every component), containing values of frequencies n
ðiÞ
0 , intensities S
ðiÞ ,
halfwidths a
ðiÞ and energy of lowest energy E
i . Every file has to contain the
information of one gaseous component. Data input strictly in ascending order of
wave numbers n
ðiÞ
0 . File names are to be composed in accordance with
instructions below.
4. To plot the absorption line intensity for every component as a straight vertical
line. On the abscissa OX values of wave number and on the ordinate OY
intensities of absorption lines in logarithmic scale are plotted (the scale of the
axes OX is to be similar). Plotting might be done in EXCEL editor.
5. To study the character of the pressure and temperature impact to:
– the intensity and halfwidth of absorption line;
– the spectral variations of the absorption coefficient.
The study is accomplished with the computer program “CONTUR_1.exe”, that
realizes the calculation of the absorption coefficient of the single absorption line.
Only Lorenz’s contour is considered.
6. To calculate the spectral dependence of every gaseous component absorption
coefficient with the program “CONTUR_2.exe”, the file of aerological sounding
data and sequentially pointing file names of every component.
Calculation is accomplished separately for 3–4 temperature values and pressure
in atmospheric layers
– 1,000 Ä 700 GPa,
– 700 Ä 300 GPa,
– 300 Ä p min GPa.
Positions of corresponding levels input with pointing numbers in tables of
aerological sounding. The table is output to the screen after every running of
the program “CONTUR_2.exe”. In every case, the resulting plot of the spectral
absorption coefficient is written to a file “contour2.dat”. All obtained results are
to be plotted and included to the final report.
7. To calculate the vertical profile of the absorption coefficient of every component
with the program “Contur_3” and file of aerological sounding data for 3 wave
numbers (for strong, moderate and weak absorption).
Table 3.4 Codes of gaseous
components
Codes
Gaseous component
1
H 2 O
2
C O 2
3
O 3
4
N 2 O
5
C O
6
C H 4
7
O 2
3.4 Practice 2
37