

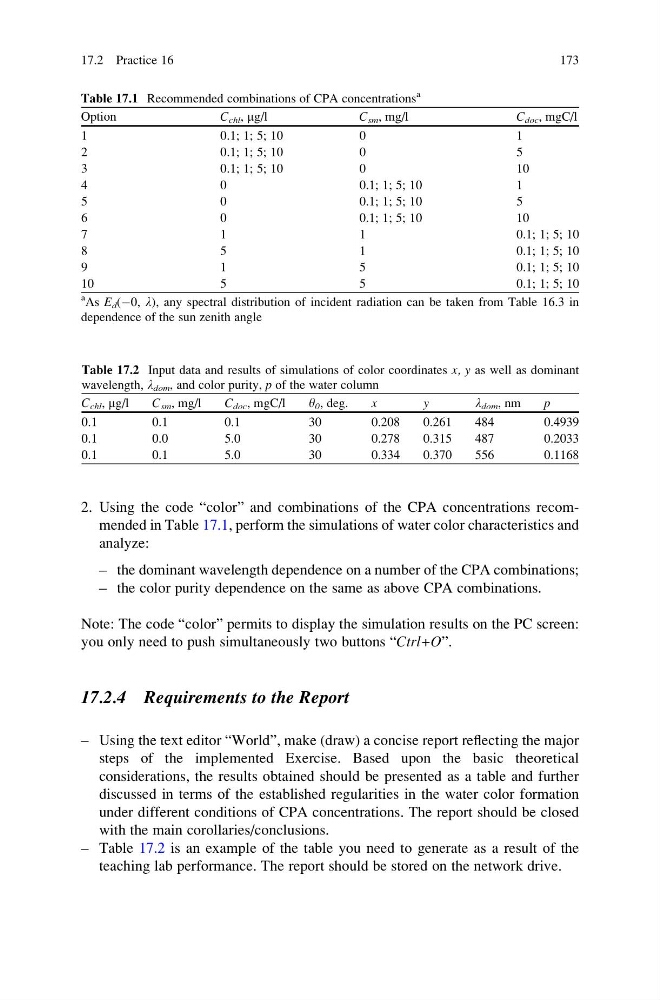
2. Using the code “color” and combinations of the CPA concentrations recommended in Table 17.1, perform the simulations of water color characteristics and
analyze:
– the dominant wavelength dependence on a number of the CPA combinations;
– the color purity dependence on the same as above CPA combinations.
Note: The code “color” permits to display the simulation results on the PC screen:
you only need to push simultaneously two buttons “Ctrl+O”.
17.2.4 Requirements to the Report
– Using the text editor “World”, make (draw) a concise report reflecting the major
steps of the implemented Exercise. Based upon the basic theoretical
considerations, the results obtained should be presented as a table and further
discussed in terms of the established regularities in the water color formation
under different conditions of CPA concentrations. The report should be closed
with the main corollaries/conclusions.
– Table 17.2 is an example of the table you need to generate as a result of the
teaching lab performance. The report should be stored on the network drive.
Table 17.2 Input data and results of simulations of color coordinates x, y as well as dominant
wavelength, l dom , and color purity, p of the water column
C chl , mg/l
C sm , mg/l
C doc , mgC/l
y 0 , deg.
x
y
l dom , nm
p
0.1
0.1
0.1
30
0.208
0.261
484
0.4939
0.1
0.0
5.0
30
0.278
0.315
487
0.2033
0.1
0.1
5.0
30
0.334
0.370
556
0.1168
Table 17.1 Recommended combinations of CPA concentrations
a
Option
C chl , mg/l
C sm , mg/l
C doc , mgC/l
1
0.1; 1; 5; 10
0
1
2
0.1; 1; 5; 10
0
5
3
0.1; 1; 5; 10
0
10
4
0
0.1; 1; 5; 10
1
5
0
0.1; 1; 5; 10
5
6
0
0.1; 1; 5; 10
10
7
1
1
0.1; 1; 5; 10
8
5
1
0.1; 1; 5; 10
9
1
5
0.1; 1; 5; 10
10
5
5
0.1; 1; 5; 10
a
As E d (À0, l), any spectral distribution of incident radiation can be taken from Table 16.3 in
dependence of the sun zenith angle
17.2 Practice 16
173
analyze:
– the dominant wavelength dependence on a number of the CPA combinations;
– the color purity dependence on the same as above CPA combinations.
Note: The code “color” permits to display the simulation results on the PC screen:
you only need to push simultaneously two buttons “Ctrl+O”.
17.2.4 Requirements to the Report
– Using the text editor “World”, make (draw) a concise report reflecting the major
steps of the implemented Exercise. Based upon the basic theoretical
considerations, the results obtained should be presented as a table and further
discussed in terms of the established regularities in the water color formation
under different conditions of CPA concentrations. The report should be closed
with the main corollaries/conclusions.
– Table 17.2 is an example of the table you need to generate as a result of the
teaching lab performance. The report should be stored on the network drive.
Table 17.2 Input data and results of simulations of color coordinates x, y as well as dominant
wavelength, l dom , and color purity, p of the water column
C chl , mg/l
C sm , mg/l
C doc , mgC/l
y 0 , deg.
x
y
l dom , nm
p
0.1
0.1
0.1
30
0.208
0.261
484
0.4939
0.1
0.0
5.0
30
0.278
0.315
487
0.2033
0.1
0.1
5.0
30
0.334
0.370
556
0.1168
Table 17.1 Recommended combinations of CPA concentrations
a
Option
C chl , mg/l
C sm , mg/l
C doc , mgC/l
1
0.1; 1; 5; 10
0
1
2
0.1; 1; 5; 10
0
5
3
0.1; 1; 5; 10
0
10
4
0
0.1; 1; 5; 10
1
5
0
0.1; 1; 5; 10
5
6
0
0.1; 1; 5; 10
10
7
1
1
0.1; 1; 5; 10
8
5
1
0.1; 1; 5; 10
9
1
5
0.1; 1; 5; 10
10
5
5
0.1; 1; 5; 10
a
As E d (À0, l), any spectral distribution of incident radiation can be taken from Table 16.3 in
dependence of the sun zenith angle
17.2 Practice 16
173