

assemblage characteristics (Chap. 6; Wedding et al. 2008; Pittman et al. 2009).
Studies have also used multispectral data (e.g., QuickBird, IKONOS) to derive
depth and structural complexity (Purkis et al. 2008; Knudby et al. 2010a, 2011),
which results in less precise measurements than LiDAR but is considerably
cheaper and requires less pre-processing time. In addition, the multispectral data
can also be used to create maps of substrate type, habitat diversity and live coral
cover (Harbourne et al. 2006; Knudby et al. 2010a, 2011).
In order to create spatial predictions, models must be developed relating field
data to remote sensing derived parameters. General linear models (GLM) have
been used by Wedding et al. (2008) with reasonable correlations; however, fish
may exhibit non-linear relationships with habitat variables. For example, using
data from Chumbe and Bawe reefs in Tanzania, Knudby et al. (2010b) found nonlinear relationships between fish species richness and live coral cover, coarse
rugosity, and depth range. Amongst the most commonly used models (including
GLM), general additive models (GAM), support vector machine, and regression
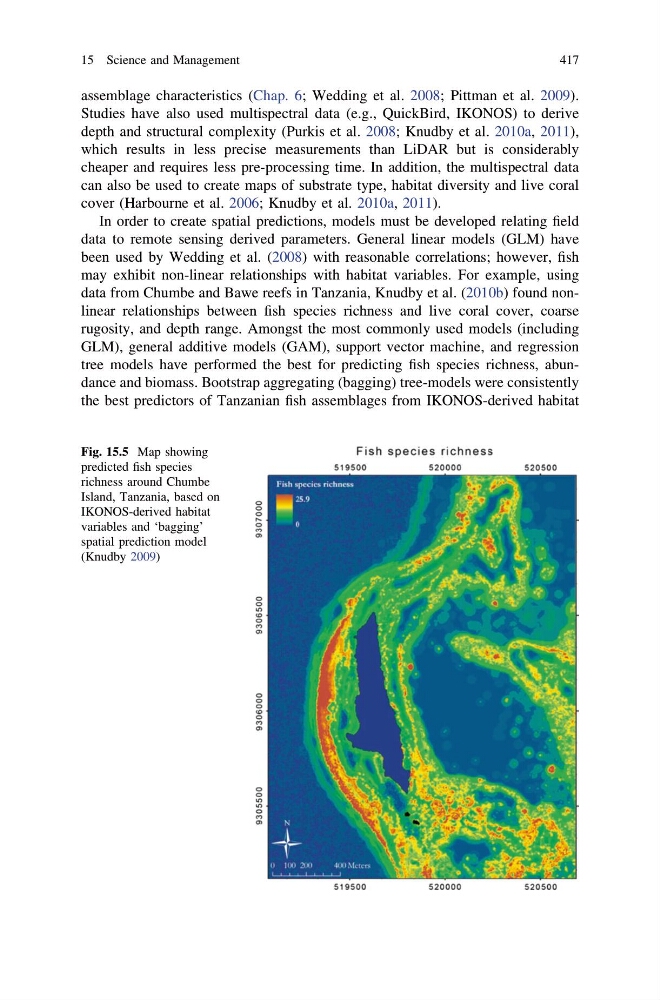
tree models have performed the best for predicting fish species richness, abundance and biomass. Bootstrap aggregating (bagging) tree-models were consistently
the best predictors of Tanzanian fish assemblages from IKONOS-derived habitat
Fig. 15.5 Map showing
predicted fish species
richness around Chumbe
Island, Tanzania, based on
IKONOS-derived habitat
variables and ‘bagging’
spatial prediction model
(Knudby 2009)
15 Science and Management
417
Studies have also used multispectral data (e.g., QuickBird, IKONOS) to derive
depth and structural complexity (Purkis et al. 2008; Knudby et al. 2010a, 2011),
which results in less precise measurements than LiDAR but is considerably
cheaper and requires less pre-processing time. In addition, the multispectral data
can also be used to create maps of substrate type, habitat diversity and live coral
cover (Harbourne et al. 2006; Knudby et al. 2010a, 2011).
In order to create spatial predictions, models must be developed relating field
data to remote sensing derived parameters. General linear models (GLM) have
been used by Wedding et al. (2008) with reasonable correlations; however, fish
may exhibit non-linear relationships with habitat variables. For example, using
data from Chumbe and Bawe reefs in Tanzania, Knudby et al. (2010b) found nonlinear relationships between fish species richness and live coral cover, coarse
rugosity, and depth range. Amongst the most commonly used models (including
GLM), general additive models (GAM), support vector machine, and regression
tree models have performed the best for predicting fish species richness, abundance and biomass. Bootstrap aggregating (bagging) tree-models were consistently
the best predictors of Tanzanian fish assemblages from IKONOS-derived habitat
Fig. 15.5 Map showing
predicted fish species
richness around Chumbe
Island, Tanzania, based on
IKONOS-derived habitat
variables and ‘bagging’
spatial prediction model
(Knudby 2009)
15 Science and Management
417