

available for Fiji, reef habitats digitized from aerial photographs by the Department of Lands were used in combination with current management area boundaries to determine that, by 2010, Fiji had already achieved effective management
of marine biodiversity on 10–22 % its coral reefs (Mills et al. 2011). Maps have
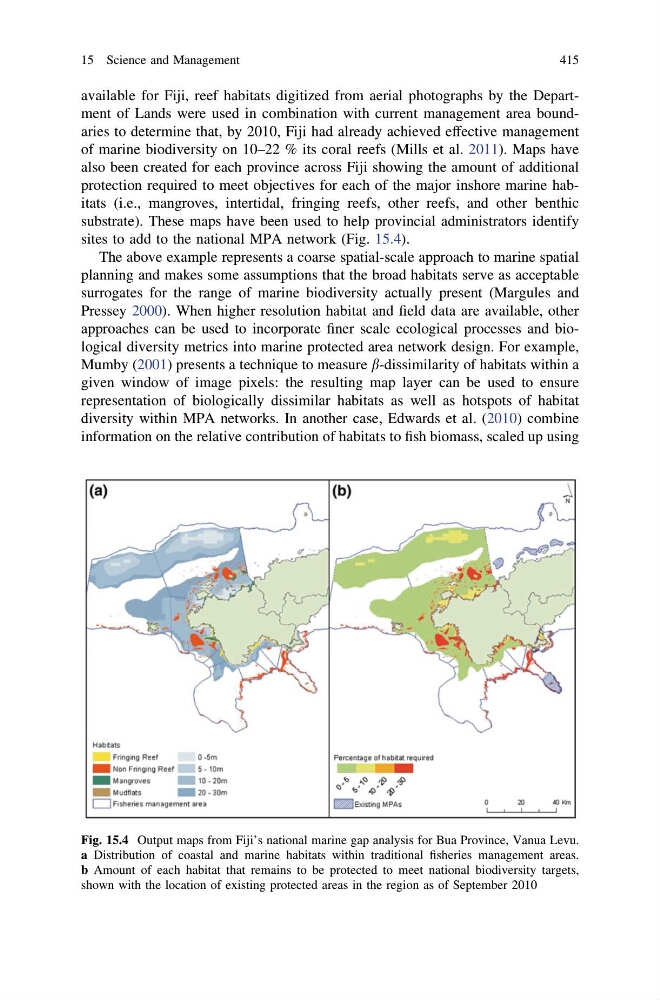
also been created for each province across Fiji showing the amount of additional
protection required to meet objectives for each of the major inshore marine habitats (i.e., mangroves, intertidal, fringing reefs, other reefs, and other benthic
substrate). These maps have been used to help provincial administrators identify
sites to add to the national MPA network (Fig. 15.4).
The above example represents a coarse spatial-scale approach to marine spatial
planning and makes some assumptions that the broad habitats serve as acceptable
surrogates for the range of marine biodiversity actually present (Margules and
Pressey 2000). When higher resolution habitat and field data are available, other
approaches can be used to incorporate finer scale ecological processes and biological diversity metrics into marine protected area network design. For example,
Mumby (2001) presents a technique to measure b-dissimilarity of habitats within a
given window of image pixels: the resulting map layer can be used to ensure
representation of biologically dissimilar habitats as well as hotspots of habitat
diversity within MPA networks. In another case, Edwards et al. (2010) combine
information on the relative contribution of habitats to fish biomass, scaled up using
Fig. 15.4 Output maps from Fiji’s national marine gap analysis for Bua Province, Vanua Levu.
a Distribution of coastal and marine habitats within traditional fisheries management areas.
b Amount of each habitat that remains to be protected to meet national biodiversity targets,
shown with the location of existing protected areas in the region as of September 2010
15 Science and Management
415
of marine biodiversity on 10–22 % its coral reefs (Mills et al. 2011). Maps have
also been created for each province across Fiji showing the amount of additional
protection required to meet objectives for each of the major inshore marine habitats (i.e., mangroves, intertidal, fringing reefs, other reefs, and other benthic
substrate). These maps have been used to help provincial administrators identify
sites to add to the national MPA network (Fig. 15.4).
The above example represents a coarse spatial-scale approach to marine spatial
planning and makes some assumptions that the broad habitats serve as acceptable
surrogates for the range of marine biodiversity actually present (Margules and
Pressey 2000). When higher resolution habitat and field data are available, other
approaches can be used to incorporate finer scale ecological processes and biological diversity metrics into marine protected area network design. For example,
Mumby (2001) presents a technique to measure b-dissimilarity of habitats within a
given window of image pixels: the resulting map layer can be used to ensure
representation of biologically dissimilar habitats as well as hotspots of habitat
diversity within MPA networks. In another case, Edwards et al. (2010) combine
information on the relative contribution of habitats to fish biomass, scaled up using
Fig. 15.4 Output maps from Fiji’s national marine gap analysis for Bua Province, Vanua Levu.
a Distribution of coastal and marine habitats within traditional fisheries management areas.
b Amount of each habitat that remains to be protected to meet national biodiversity targets,
shown with the location of existing protected areas in the region as of September 2010
15 Science and Management
415