

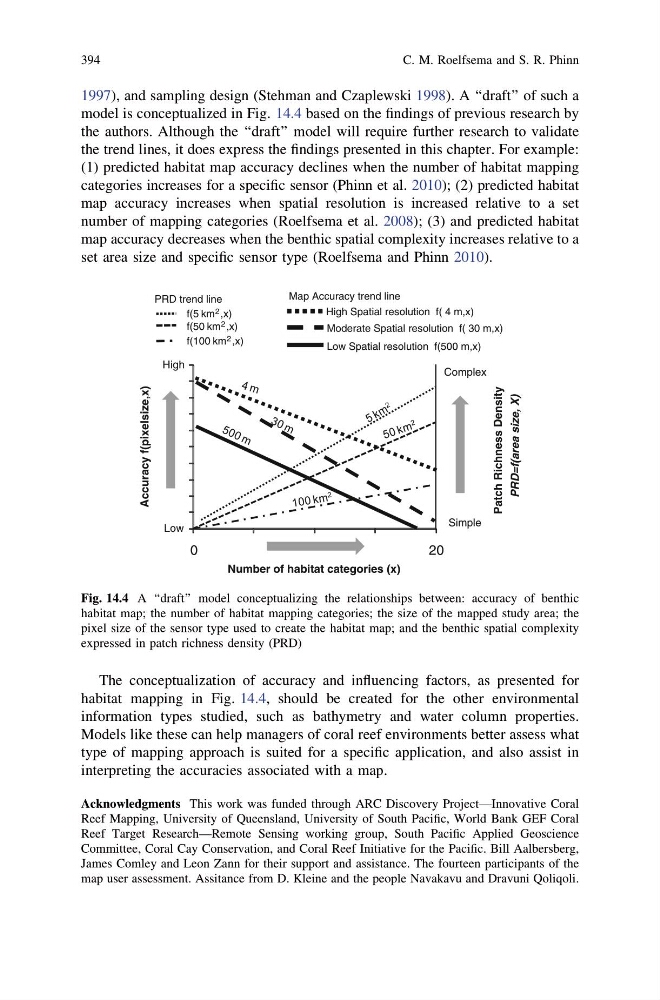
1997), and sampling design (Stehman and Czaplewski 1998). A ‘‘draft’’ of such a
model is conceptualized in Fig. 14.4 based on the findings of previous research by
the authors. Although the ‘‘draft’’ model will require further research to validate
the trend lines, it does express the findings presented in this chapter. For example:
(1) predicted habitat map accuracy declines when the number of habitat mapping
categories increases for a specific sensor (Phinn et al. 2010); (2) predicted habitat
map accuracy increases when spatial resolution is increased relative to a set
number of mapping categories (Roelfsema et al. 2008); (3) and predicted habitat
map accuracy decreases when the benthic spatial complexity increases relative to a
set area size and specific sensor type (Roelfsema and Phinn 2010).
The conceptualization of accuracy and influencing factors, as presented for
habitat mapping in Fig. 14.4, should be created for the other environmental
information types studied, such as bathymetry and water column properties.
Models like these can help managers of coral reef environments better assess what
type of mapping approach is suited for a specific application, and also assist in
interpreting the accuracies associated with a map.
Acknowledgments This work was funded through ARC Discovery Project—Innovative Coral
Reef Mapping, University of Queensland, University of South Pacific, World Bank GEF Coral
Reef Target Research—Remote Sensing working group, South Pacific Applied Geoscience
Committee, Coral Cay Conservation, and Coral Reef Initiative for the Pacific. Bill Aalbersberg,
James Comley and Leon Zann for their support and assistance. The fourteen participants of the
map user assessment. Assitance from D. Kleine and the people Navakavu and Dravuni Qoliqoli.
Low
High
0
2 0
Accuracy f(pixelsize,x)
Number of habitat categories (x)
High Spatial resolution f( 4 m,x)
Patch Richness Density
PRD=f(area size, X)
f(5 km 2 ,x)
f(50 km 2 ,x)
f(100 km 2 ,x)
Complex
Simple
PRD trend line
Map Accuracy trend line
Moderate Spatial resolution f( 30 m,x)
Low Spatial resolution f(500 m,x)
Fig. 14.4 A ‘‘draft’’ model conceptualizing the relationships between: accuracy of benthic
habitat map; the number of habitat mapping categories; the size of the mapped study area; the
pixel size of the sensor type used to create the habitat map; and the benthic spatial complexity
expressed in patch richness density (PRD)
394
C. M. Roelfsema and S. R. Phinn
model is conceptualized in Fig. 14.4 based on the findings of previous research by
the authors. Although the ‘‘draft’’ model will require further research to validate
the trend lines, it does express the findings presented in this chapter. For example:
(1) predicted habitat map accuracy declines when the number of habitat mapping
categories increases for a specific sensor (Phinn et al. 2010); (2) predicted habitat
map accuracy increases when spatial resolution is increased relative to a set
number of mapping categories (Roelfsema et al. 2008); (3) and predicted habitat
map accuracy decreases when the benthic spatial complexity increases relative to a
set area size and specific sensor type (Roelfsema and Phinn 2010).
The conceptualization of accuracy and influencing factors, as presented for
habitat mapping in Fig. 14.4, should be created for the other environmental
information types studied, such as bathymetry and water column properties.
Models like these can help managers of coral reef environments better assess what
type of mapping approach is suited for a specific application, and also assist in
interpreting the accuracies associated with a map.
Acknowledgments This work was funded through ARC Discovery Project—Innovative Coral
Reef Mapping, University of Queensland, University of South Pacific, World Bank GEF Coral
Reef Target Research—Remote Sensing working group, South Pacific Applied Geoscience
Committee, Coral Cay Conservation, and Coral Reef Initiative for the Pacific. Bill Aalbersberg,
James Comley and Leon Zann for their support and assistance. The fourteen participants of the
map user assessment. Assitance from D. Kleine and the people Navakavu and Dravuni Qoliqoli.
Low
High
0
2 0
Accuracy f(pixelsize,x)
Number of habitat categories (x)
High Spatial resolution f( 4 m,x)
Patch Richness Density
PRD=f(area size, X)
f(5 km 2 ,x)
f(50 km 2 ,x)
f(100 km 2 ,x)
Complex
Simple
PRD trend line
Map Accuracy trend line
Moderate Spatial resolution f( 30 m,x)
Low Spatial resolution f(500 m,x)
Fig. 14.4 A ‘‘draft’’ model conceptualizing the relationships between: accuracy of benthic
habitat map; the number of habitat mapping categories; the size of the mapped study area; the
pixel size of the sensor type used to create the habitat map; and the benthic spatial complexity
expressed in patch richness density (PRD)
394
C. M. Roelfsema and S. R. Phinn