

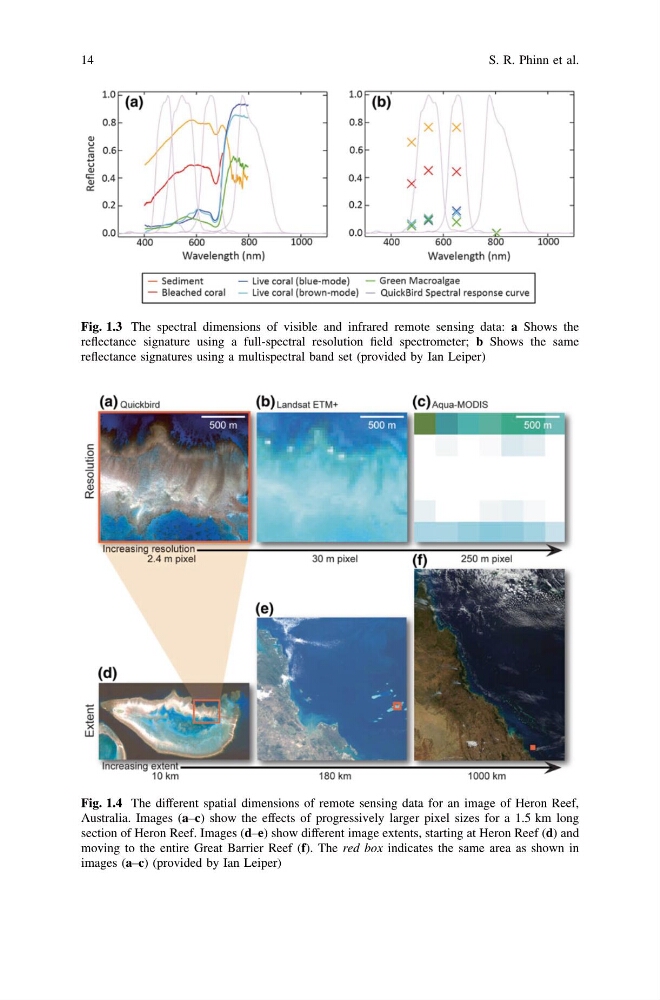
Fig. 1.3 The spectral dimensions of visible and infrared remote sensing data: a Shows the
reflectance signature using a full-spectral resolution field spectrometer; b Shows the same
reflectance signatures using a multispectral band set (provided by Ian Leiper)
Fig. 1.4 The different spatial dimensions of remote sensing data for an image of Heron Reef,
Australia. Images (a–c) show the effects of progressively larger pixel sizes for a 1.5 km long
section of Heron Reef. Images (d–e) show different image extents, starting at Heron Reef (d) and
moving to the entire Great Barrier Reef (f). The red box indicates the same area as shown in
images (a–c) (provided by Ian Leiper)
14
S. R. Phinn et al.
reflectance signature using a full-spectral resolution field spectrometer; b Shows the same
reflectance signatures using a multispectral band set (provided by Ian Leiper)
Fig. 1.4 The different spatial dimensions of remote sensing data for an image of Heron Reef,
Australia. Images (a–c) show the effects of progressively larger pixel sizes for a 1.5 km long
section of Heron Reef. Images (d–e) show different image extents, starting at Heron Reef (d) and
moving to the entire Great Barrier Reef (f). The red box indicates the same area as shown in
images (a–c) (provided by Ian Leiper)
14
S. R. Phinn et al.