

possibility of false alarms, or false detections, the models are built to balance the
probability of a false alarm versus that of detection. A delicate balance exists here:
the more the detection threshold is lowered, the more signal will be detected but
also the more false alarms due to noise will be incurred (resulting in, for example,
erroneous depth measurements). Much work and experimental verification goes
into the development of a useful receiver operating curve (ROC), which helps
define these thresholds. Further processing is also done to improve the signal-tonoise ratio in order to enhance the probability of target detection or interpretation of
signal shape. After this step, signal processing is typically performed using the
temporal, spatial, or spectral variations in the recorded signals. For example, signal
strength along a time axis can be evaluated for its shape or specific points of
deflection, such as in the bottom identification algorithms of common depth
sounders. Additional processing can incorporate cross-section graphs, surface
models of survey area, seafloor mosaics, or volumetric representations.
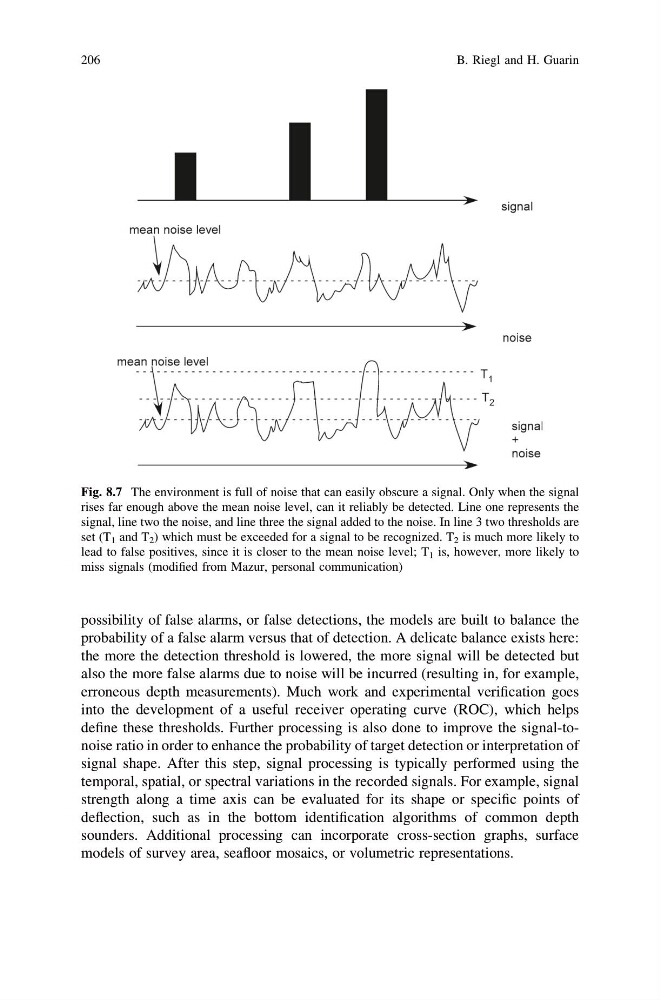
Fig. 8.7 The environment is full of noise that can easily obscure a signal. Only when the signal
rises far enough above the mean noise level, can it reliably be detected. Line one represents the
signal, line two the noise, and line three the signal added to the noise. In line 3 two thresholds are
set (T 1 and T 2 ) which must be exceeded for a signal to be recognized. T 2 is much more likely to
lead to false positives, since it is closer to the mean noise level; T 1 is, however, more likely to
miss signals (modified from Mazur, personal communication)
206
B. Riegl and H. Guarin
probability of a false alarm versus that of detection. A delicate balance exists here:
the more the detection threshold is lowered, the more signal will be detected but
also the more false alarms due to noise will be incurred (resulting in, for example,
erroneous depth measurements). Much work and experimental verification goes
into the development of a useful receiver operating curve (ROC), which helps
define these thresholds. Further processing is also done to improve the signal-tonoise ratio in order to enhance the probability of target detection or interpretation of
signal shape. After this step, signal processing is typically performed using the
temporal, spatial, or spectral variations in the recorded signals. For example, signal
strength along a time axis can be evaluated for its shape or specific points of
deflection, such as in the bottom identification algorithms of common depth
sounders. Additional processing can incorporate cross-section graphs, surface
models of survey area, seafloor mosaics, or volumetric representations.
Fig. 8.7 The environment is full of noise that can easily obscure a signal. Only when the signal
rises far enough above the mean noise level, can it reliably be detected. Line one represents the
signal, line two the noise, and line three the signal added to the noise. In line 3 two thresholds are
set (T 1 and T 2 ) which must be exceeded for a signal to be recognized. T 2 is much more likely to
lead to false positives, since it is closer to the mean noise level; T 1 is, however, more likely to
miss signals (modified from Mazur, personal communication)
206
B. Riegl and H. Guarin