

line on aerial photographs as the shoreline proxy (Liu et al. 2007). Beyond
shoreline extraction, DEMs support the three dimensional visualization of coast
habitat and volumetric change analysis in these systems (Zhang et al. 2009). For
instance, DEMs produced from LiDAR data have been used to study geomorphological change in coastlines and barrier islands (White and Wang 2003).
Further, LiDAR-derived metrics have been applied to establish a relationship
between coastal erosion and accretion with beach morphology. Saye et al. (2005),
for example, found that LiDAR characterized eroding dunes commonly located in
association with steep-sloping, narrow beaches and that accreting dunes were
found adjacent to low-sloping, wide beaches.
6.3 Future Directions in LiDAR
6.3.1 Integration with Other Sensors
In the last decade, research in data fusion and integration techniques has grown
with access to multi-resolution, multi-temporal and multi-frequency datasets (Pohl
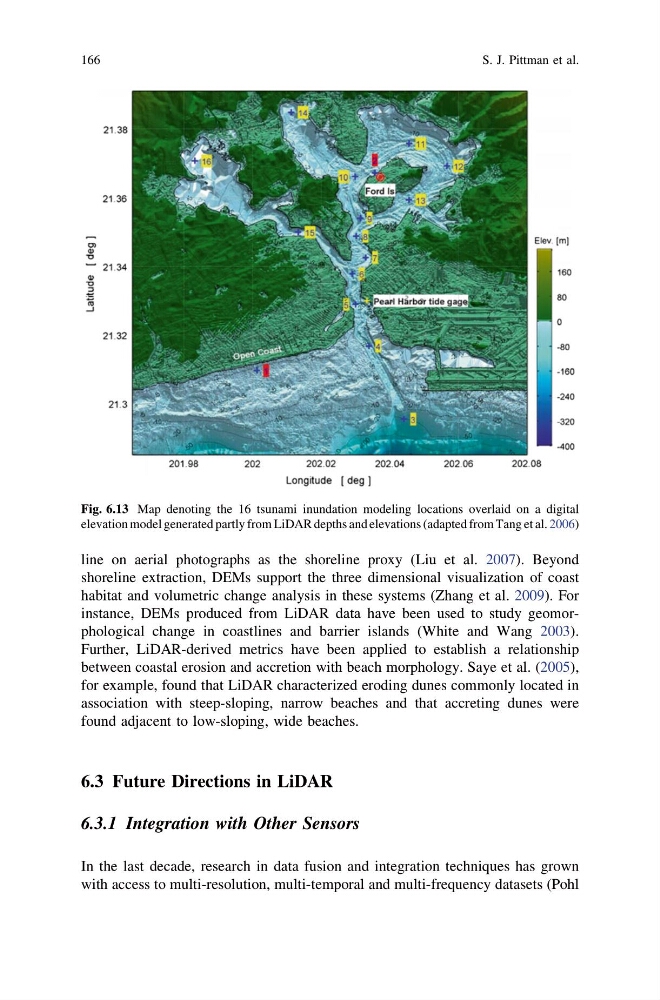
Fig. 6.13 Map denoting the 16 tsunami inundation modeling locations overlaid on a digital
elevation model generated partly from LiDAR depths and elevations (adapted from Tang et al. 2006)
166
S. J. Pittman et al.
shoreline extraction, DEMs support the three dimensional visualization of coast
habitat and volumetric change analysis in these systems (Zhang et al. 2009). For
instance, DEMs produced from LiDAR data have been used to study geomorphological change in coastlines and barrier islands (White and Wang 2003).
Further, LiDAR-derived metrics have been applied to establish a relationship
between coastal erosion and accretion with beach morphology. Saye et al. (2005),
for example, found that LiDAR characterized eroding dunes commonly located in
association with steep-sloping, narrow beaches and that accreting dunes were
found adjacent to low-sloping, wide beaches.
6.3 Future Directions in LiDAR
6.3.1 Integration with Other Sensors
In the last decade, research in data fusion and integration techniques has grown
with access to multi-resolution, multi-temporal and multi-frequency datasets (Pohl
Fig. 6.13 Map denoting the 16 tsunami inundation modeling locations overlaid on a digital
elevation model generated partly from LiDAR depths and elevations (adapted from Tang et al. 2006)
166
S. J. Pittman et al.