

charting, some effort must be made to separate the bare-earth seabed model from
the clutter which may represent a hazard to navigation.
In its native form, a LiDAR dataset is composed of discrete topographic
soundings. Contour maps, DEMs, and TINs (triangulated area networks) can be
extracted from the point-cloud to yield a topographic surface. This information has
considerable utility when combined with passive satellite or aircraft imagery,
because, by offering an independent measure of bathymetry, it can be used as input
to a spectral water column correction (see Chap. 7).
While not a pixel-based imaging technology, bathymetric LiDAR soundings
can be interpolated to a raster and viewed as a single-band image (Fig. 5.5).
Processed in this way, the data reveal a picture of seabed topography and can be
used as the basis for mapping, much like a satellite image (Storlazzi et al. 2003;
Brock et al. 2004, 2006; Tuell et al. 2005; Collin et al. 2008; Walker et al. 2008;
Nayegandhi and Brock 2008; Purkis and Kohler 2008; Costa et al. 2009). Once
rasterized, derivative products such as contour maps and hillshade-relief images
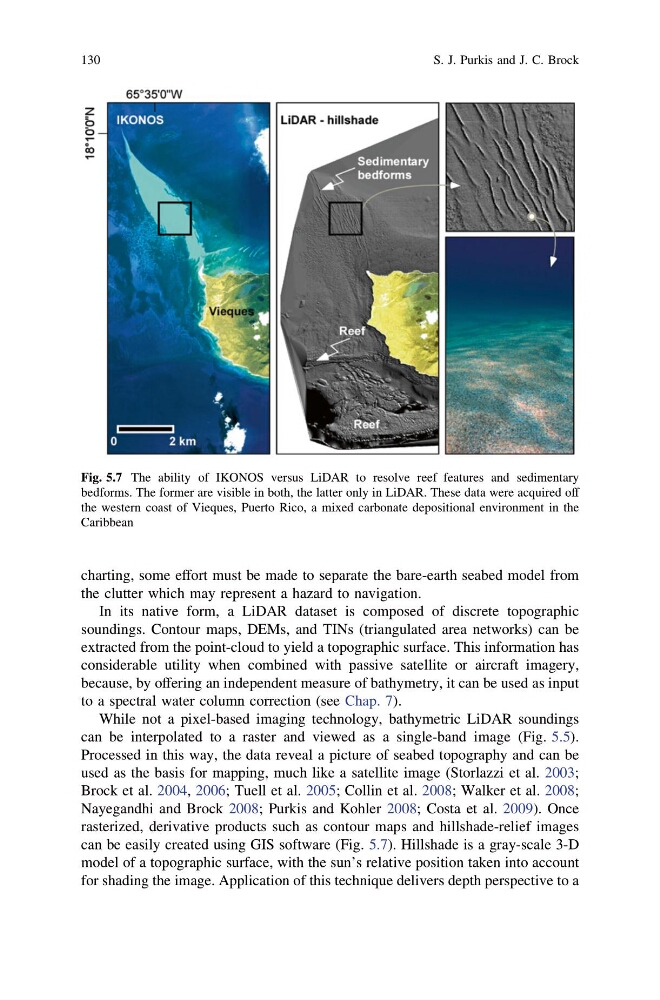
can be easily created using GIS software (Fig. 5.7). Hillshade is a gray-scale 3-D
model of a topographic surface, with the sun’s relative position taken into account
for shading the image. Application of this technique delivers depth perspective to a
Fig. 5.7 The ability of IKONOS versus LiDAR to resolve reef features and sedimentary
bedforms. The former are visible in both, the latter only in LiDAR. These data were acquired off
the western coast of Vieques, Puerto Rico, a mixed carbonate depositional environment in the
Caribbean
130
S. J. Purkis and J. C. Brock
the clutter which may represent a hazard to navigation.
In its native form, a LiDAR dataset is composed of discrete topographic
soundings. Contour maps, DEMs, and TINs (triangulated area networks) can be
extracted from the point-cloud to yield a topographic surface. This information has
considerable utility when combined with passive satellite or aircraft imagery,
because, by offering an independent measure of bathymetry, it can be used as input
to a spectral water column correction (see Chap. 7).
While not a pixel-based imaging technology, bathymetric LiDAR soundings
can be interpolated to a raster and viewed as a single-band image (Fig. 5.5).
Processed in this way, the data reveal a picture of seabed topography and can be
used as the basis for mapping, much like a satellite image (Storlazzi et al. 2003;
Brock et al. 2004, 2006; Tuell et al. 2005; Collin et al. 2008; Walker et al. 2008;
Nayegandhi and Brock 2008; Purkis and Kohler 2008; Costa et al. 2009). Once
rasterized, derivative products such as contour maps and hillshade-relief images
can be easily created using GIS software (Fig. 5.7). Hillshade is a gray-scale 3-D
model of a topographic surface, with the sun’s relative position taken into account
for shading the image. Application of this technique delivers depth perspective to a
Fig. 5.7 The ability of IKONOS versus LiDAR to resolve reef features and sedimentary
bedforms. The former are visible in both, the latter only in LiDAR. These data were acquired off
the western coast of Vieques, Puerto Rico, a mixed carbonate depositional environment in the
Caribbean
130
S. J. Purkis and J. C. Brock