

CASI Image color composite
Bathymetry
Depth (m)
Live coral
Sand
Dead coral / Algal turf
Macroalgae
Proportion
1.0
10
0
20
0.5
0.0
(a)
(c)
(d)
(e)
(f)
(b)
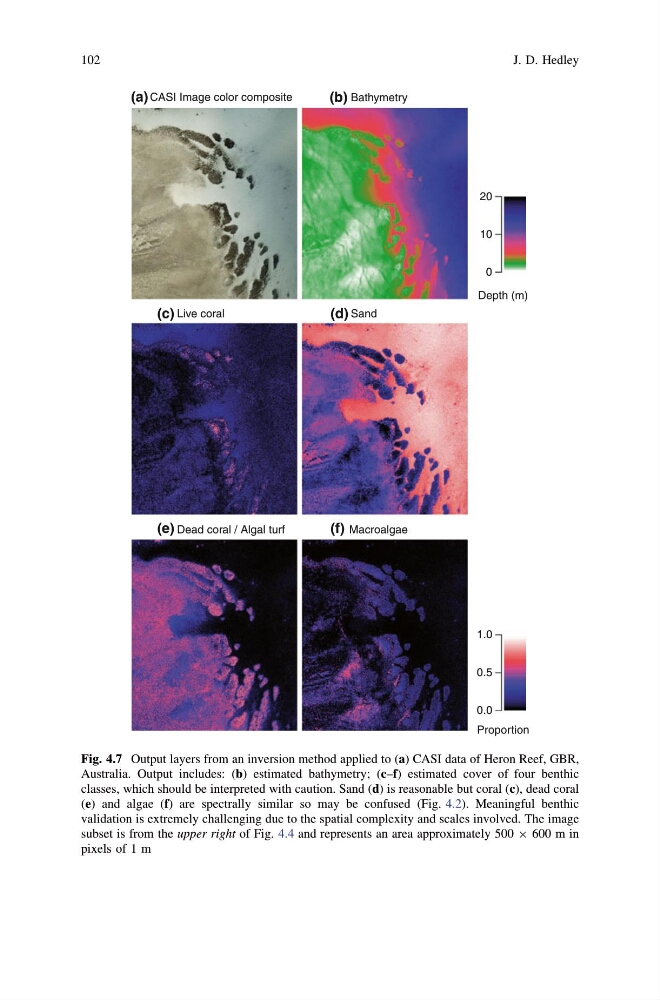
Fig. 4.7 Output layers from an inversion method applied to (a) CASI data of Heron Reef, GBR,
Australia. Output includes: (b) estimated bathymetry; (c–f) estimated cover of four benthic
classes, which should be interpreted with caution. Sand (d) is reasonable but coral (c), dead coral
(e) and algae (f) are spectrally similar so may be confused (Fig. 4.2). Meaningful benthic
validation is extremely challenging due to the spatial complexity and scales involved. The image
subset is from the upper right of Fig. 4.4 and represents an area approximately 500 9 600 m in
pixels of 1 m
102
J. D. Hedley
Bathymetry
Depth (m)
Live coral
Sand
Dead coral / Algal turf
Macroalgae
Proportion
1.0
10
0
20
0.5
0.0
(a)
(c)
(d)
(e)
(f)
(b)
Fig. 4.7 Output layers from an inversion method applied to (a) CASI data of Heron Reef, GBR,
Australia. Output includes: (b) estimated bathymetry; (c–f) estimated cover of four benthic
classes, which should be interpreted with caution. Sand (d) is reasonable but coral (c), dead coral
(e) and algae (f) are spectrally similar so may be confused (Fig. 4.2). Meaningful benthic
validation is extremely challenging due to the spatial complexity and scales involved. The image
subset is from the upper right of Fig. 4.4 and represents an area approximately 500 9 600 m in
pixels of 1 m
102
J. D. Hedley