

(GCPs) to position and scale the images with respect to existing orthorectified
LANDSAT-7 ETM+ images (from the 1999 to 2002 period) obtained from
Geobase Canada website, http://geobase.ca, last accessed on 28 June 2008.
15.3.2 Deriving WI-Values and Associated Images
As an initial step, both low and high scattering land-surface features, such as water
bodies and corner reflectors, were eliminated from the multi-temporal images. To
do this, we used the density slicing approach of Lillesand et al. (2008) and
delineation limits of β
0 (dB) <À12.22 and !0.00 to identify all water bodies and
corner reflectors in the images.
For a given pixel and image, if a pixel was classified as either being water or a
corner reflector in any one image, it was assumed that the same feature was also
present in the other two images and excluded from all three images. Following
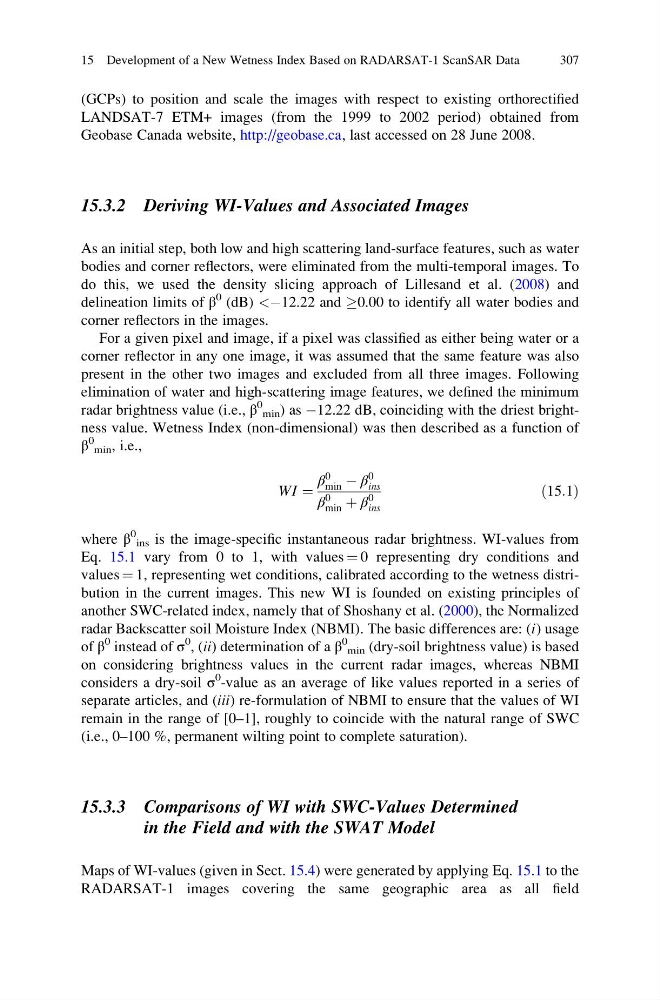
elimination of water and high-scattering image features, we defined the minimum
radar brightness value (i.e., β
0
min ) as À12.22 dB, coinciding with the driest brightness value. Wetness Index (non-dimensional) was then described as a function of
β
0
min , i.e.,
WI ¼
β
0
min À β
0
ins
β
0
min þ β
0
ins
ð15:1Þ
where β
0
ins is the image-specific instantaneous radar brightness. WI-values from
Eq. 15.1 vary from 0 to 1, with values ¼ 0 representing dry conditions and
values ¼ 1, representing wet conditions, calibrated according to the wetness distribution in the current images. This new WI is founded on existing principles of
another SWC-related index, namely that of Shoshany et al. (2000), the Normalized
radar Backscatter soil Moisture Index (NBMI). The basic differences are: (i) usage
of β
0 instead of σ
0
, (ii) determination of a β
0
min (dry-soil brightness value) is based
on considering brightness values in the current radar images, whereas NBMI
considers a dry-soil σ
0 -value as an average of like values reported in a series of
separate articles, and (iii) re-formulation of NBMI to ensure that the values of WI
remain in the range of [0–1], roughly to coincide with the natural range of SWC
(i.e., 0–100 %, permanent wilting point to complete saturation).
15.3.3 Comparisons of WI with SWC-Values Determined
in the Field and with the SWAT Model
Maps of WI-values (given in Sect. 15.4) were generated by applying Eq. 15.1 to the
RADARSAT-1 images covering the same geographic area as all field
15 Development of a New Wetness Index Based on RADARSAT-1 ScanSAR Data
307
LANDSAT-7 ETM+ images (from the 1999 to 2002 period) obtained from
Geobase Canada website, http://geobase.ca, last accessed on 28 June 2008.
15.3.2 Deriving WI-Values and Associated Images
As an initial step, both low and high scattering land-surface features, such as water
bodies and corner reflectors, were eliminated from the multi-temporal images. To
do this, we used the density slicing approach of Lillesand et al. (2008) and
delineation limits of β
0 (dB) <À12.22 and !0.00 to identify all water bodies and
corner reflectors in the images.
For a given pixel and image, if a pixel was classified as either being water or a
corner reflector in any one image, it was assumed that the same feature was also
present in the other two images and excluded from all three images. Following
elimination of water and high-scattering image features, we defined the minimum
radar brightness value (i.e., β
0
min ) as À12.22 dB, coinciding with the driest brightness value. Wetness Index (non-dimensional) was then described as a function of
β
0
min , i.e.,
WI ¼
β
0
min À β
0
ins
β
0
min þ β
0
ins
ð15:1Þ
where β
0
ins is the image-specific instantaneous radar brightness. WI-values from
Eq. 15.1 vary from 0 to 1, with values ¼ 0 representing dry conditions and
values ¼ 1, representing wet conditions, calibrated according to the wetness distribution in the current images. This new WI is founded on existing principles of
another SWC-related index, namely that of Shoshany et al. (2000), the Normalized
radar Backscatter soil Moisture Index (NBMI). The basic differences are: (i) usage
of β
0 instead of σ
0
, (ii) determination of a β
0
min (dry-soil brightness value) is based
on considering brightness values in the current radar images, whereas NBMI
considers a dry-soil σ
0 -value as an average of like values reported in a series of
separate articles, and (iii) re-formulation of NBMI to ensure that the values of WI
remain in the range of [0–1], roughly to coincide with the natural range of SWC
(i.e., 0–100 %, permanent wilting point to complete saturation).
15.3.3 Comparisons of WI with SWC-Values Determined
in the Field and with the SWAT Model
Maps of WI-values (given in Sect. 15.4) were generated by applying Eq. 15.1 to the
RADARSAT-1 images covering the same geographic area as all field
15 Development of a New Wetness Index Based on RADARSAT-1 ScanSAR Data
307