

showed that the reduction rates were only several percentages or more. Compared
with these studies, the estimated reduction rate of the present study is not so low.
Under the scenarios with technological mitigation measures (BAU2, Mit.2,
Ad.2, Mit.+Ad.2), the introduction of EVs has the potential to reduce both direct
and indirect emissions from gasoline use (Emission group: 7. Transportation and
communication). Instead, indirect emissions in Emission group 3 (Fuel, light and
water charges) would increase due to the battery charge of EVs. As to the introduction of PVs, some or all of the electric power demand of each household could
be covered by PV power generation. The indirect emissions in Emission group
3 could be reduced because people would save electricity supplied by the electric
power company.
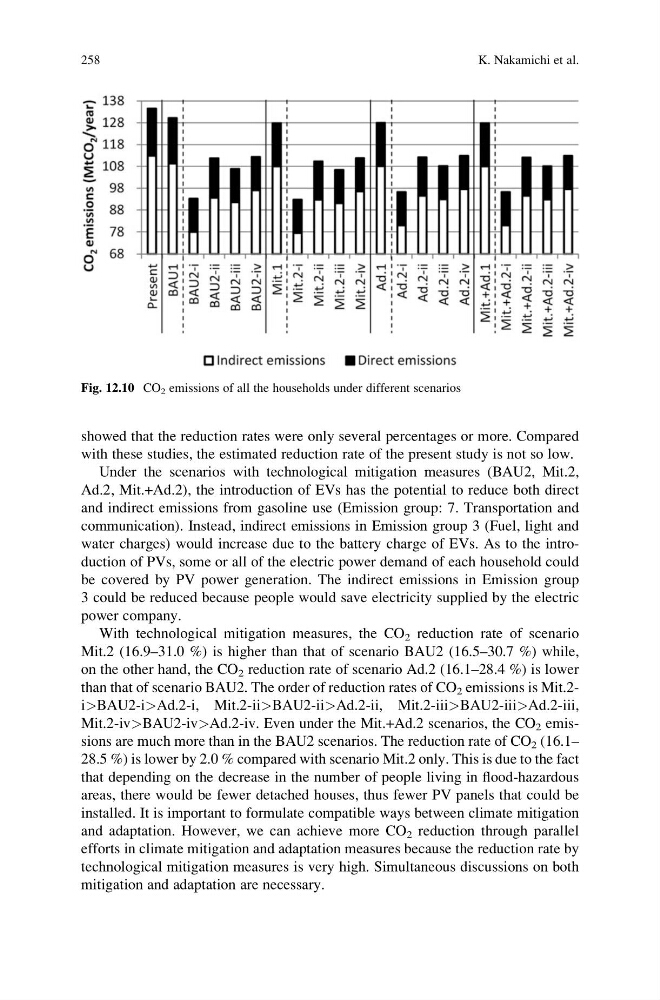
With technological mitigation measures, the CO 2 reduction rate of scenario
Mit.2 (16.9–31.0 %) is higher than that of scenario BAU2 (16.5–30.7 %) while,
on the other hand, the CO 2 reduction rate of scenario Ad.2 (16.1–28.4 %) is lower
than that of scenario BAU2. The order of reduction rates of CO 2 emissions is Mit.2i>BAU2-i>Ad.2-i, Mit.2-ii>BAU2-ii>Ad.2-ii, Mit.2-iii>BAU2-iii>Ad.2-iii,
Mit.2-iv>BAU2-iv>Ad.2-iv. Even under the Mit.+Ad.2 scenarios, the CO 2 emissions are much more than in the BAU2 scenarios. The reduction rate of CO 2 (16.1–
28.5 %) is lower by 2.0 % compared with scenario Mit.2 only. This is due to the fact
that depending on the decrease in the number of people living in flood-hazardous
areas, there would be fewer detached houses, thus fewer PV panels that could be
installed. It is important to formulate compatible ways between climate mitigation
and adaptation. However, we can achieve more CO 2 reduction through parallel
efforts in climate mitigation and adaptation measures because the reduction rate by
technological mitigation measures is very high. Simultaneous discussions on both
mitigation and adaptation are necessary.
Fig. 12.10 CO 2 emissions of all the households under different scenarios
258
K. Nakamichi et al.
with these studies, the estimated reduction rate of the present study is not so low.
Under the scenarios with technological mitigation measures (BAU2, Mit.2,
Ad.2, Mit.+Ad.2), the introduction of EVs has the potential to reduce both direct
and indirect emissions from gasoline use (Emission group: 7. Transportation and
communication). Instead, indirect emissions in Emission group 3 (Fuel, light and
water charges) would increase due to the battery charge of EVs. As to the introduction of PVs, some or all of the electric power demand of each household could
be covered by PV power generation. The indirect emissions in Emission group
3 could be reduced because people would save electricity supplied by the electric
power company.
With technological mitigation measures, the CO 2 reduction rate of scenario
Mit.2 (16.9–31.0 %) is higher than that of scenario BAU2 (16.5–30.7 %) while,
on the other hand, the CO 2 reduction rate of scenario Ad.2 (16.1–28.4 %) is lower
than that of scenario BAU2. The order of reduction rates of CO 2 emissions is Mit.2i>BAU2-i>Ad.2-i, Mit.2-ii>BAU2-ii>Ad.2-ii, Mit.2-iii>BAU2-iii>Ad.2-iii,
Mit.2-iv>BAU2-iv>Ad.2-iv. Even under the Mit.+Ad.2 scenarios, the CO 2 emissions are much more than in the BAU2 scenarios. The reduction rate of CO 2 (16.1–
28.5 %) is lower by 2.0 % compared with scenario Mit.2 only. This is due to the fact
that depending on the decrease in the number of people living in flood-hazardous
areas, there would be fewer detached houses, thus fewer PV panels that could be
installed. It is important to formulate compatible ways between climate mitigation
and adaptation. However, we can achieve more CO 2 reduction through parallel
efforts in climate mitigation and adaptation measures because the reduction rate by
technological mitigation measures is very high. Simultaneous discussions on both
mitigation and adaptation are necessary.
Fig. 12.10 CO 2 emissions of all the households under different scenarios
258
K. Nakamichi et al.