

routed from hill slopes to the river channel and ultimately to the outlet. The surface
and subsurface hydrological processes of CDRMV3 are provided in each grid cell
based on the kinematic wave method. The hydrological processes of this model
have been divided into three lateral flow mechanisms including (1) subsurface flow
through the unsaturated layer, (2) subsurface flow through the saturated layer and
(3) surface flow on the soil layer (Luo et al. 2012). At each grid-cell, when the water
depth is lower than the equivalent water depth for unsaturated flow (0 h d m ),
flow is simulated by Darcy’s law with an unsaturated hydraulic conductivity k m .
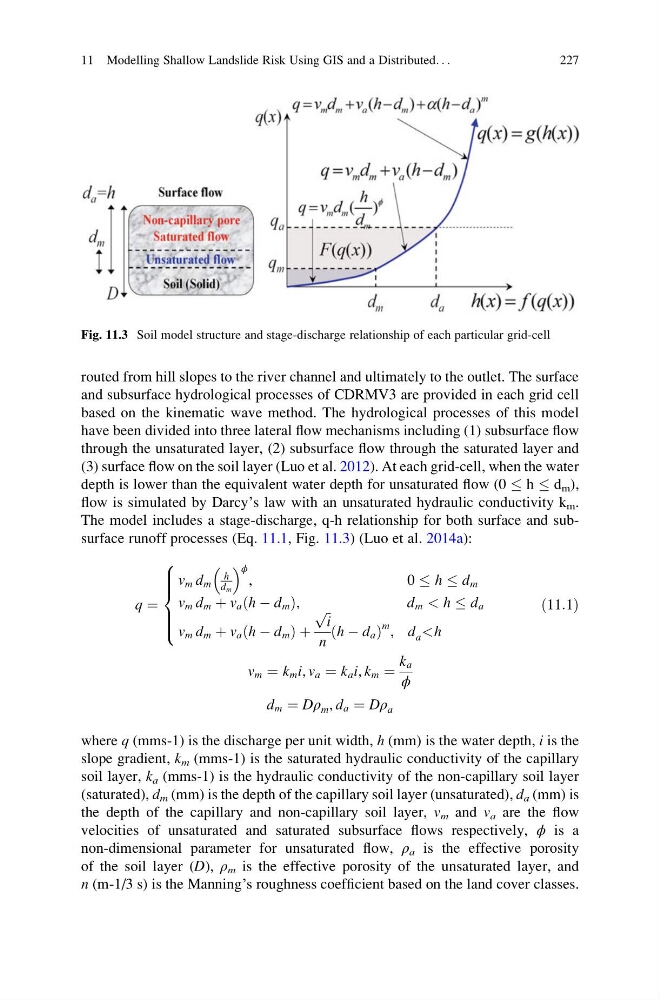
The model includes a stage-discharge, q-h relationship for both surface and subsurface runoff processes (Eq. 11.1, Fig. 11.3) (Luo et al. 2014a):
q ¼
v m d m
h
d m
ϕ
,
0 h d m
v m d m þ v a h À d m
ð
Þ,
d m < h d a
v m d m þ v a h À d m
ð
Þþ
ffi ffi
i
p
n
h À d a
ð
Þ
m , d a
> > > <
> > > :
ð11:1Þ
v m ¼ k m i, v a ¼ k a i, k m ¼
k a
ϕ
d m ¼ Dρ m , d a ¼ Dρ a
where q (mms-1) is the discharge per unit width, h (mm) is the water depth, i is the
slope gradient, k m (mms-1) is the saturated hydraulic conductivity of the capillary
soil layer, k a (mms-1) is the hydraulic conductivity of the non-capillary soil layer
(saturated), d m (mm) is the depth of the capillary soil layer (unsaturated), d a (mm) is
the depth of the capillary and non-capillary soil layer, v m and v a are the flow
velocities of unsaturated and saturated subsurface flows respectively, ϕ is a
non-dimensional parameter for unsaturated flow, ρ a is the effective porosity
of the soil layer (D), ρ m is the effective porosity of the unsaturated layer, and
n (m-1/3 s) is the Manning’s roughness coefficient based on the land cover classes.
Fig. 11.3 Soil model structure and stage-discharge relationship of each particular grid-cell
11 Modelling Shallow Landslide Risk Using GIS and a Distributed. . .
227
and subsurface hydrological processes of CDRMV3 are provided in each grid cell
based on the kinematic wave method. The hydrological processes of this model
have been divided into three lateral flow mechanisms including (1) subsurface flow
through the unsaturated layer, (2) subsurface flow through the saturated layer and
(3) surface flow on the soil layer (Luo et al. 2012). At each grid-cell, when the water
depth is lower than the equivalent water depth for unsaturated flow (0 h d m ),
flow is simulated by Darcy’s law with an unsaturated hydraulic conductivity k m .
The model includes a stage-discharge, q-h relationship for both surface and subsurface runoff processes (Eq. 11.1, Fig. 11.3) (Luo et al. 2014a):
q ¼
v m d m
h
d m
ϕ
,
0 h d m
v m d m þ v a h À d m
ð
Þ,
d m < h d a
v m d m þ v a h À d m
ð
Þþ
ffi ffi
i
p
n
h À d a
ð
Þ
m , d a
> > > <
> > > :
ð11:1Þ
v m ¼ k m i, v a ¼ k a i, k m ¼
k a
ϕ
d m ¼ Dρ m , d a ¼ Dρ a
where q (mms-1) is the discharge per unit width, h (mm) is the water depth, i is the
slope gradient, k m (mms-1) is the saturated hydraulic conductivity of the capillary
soil layer, k a (mms-1) is the hydraulic conductivity of the non-capillary soil layer
(saturated), d m (mm) is the depth of the capillary soil layer (unsaturated), d a (mm) is
the depth of the capillary and non-capillary soil layer, v m and v a are the flow
velocities of unsaturated and saturated subsurface flows respectively, ϕ is a
non-dimensional parameter for unsaturated flow, ρ a is the effective porosity
of the soil layer (D), ρ m is the effective porosity of the unsaturated layer, and
n (m-1/3 s) is the Manning’s roughness coefficient based on the land cover classes.
Fig. 11.3 Soil model structure and stage-discharge relationship of each particular grid-cell
11 Modelling Shallow Landslide Risk Using GIS and a Distributed. . .
227