

10.5 Land Use Vulnerability Map
10.5.1 Risk Ranks
With another factor, “distance from the sea,” added to the previous four groups, a
total of 686 meshes and 9 new clusters were classified (Fig. 10.5). The CPCC was
0.897. Since the inland area had a lower erosion risk than did the coastal area, the
risk ranking assigned to the new clusters were as follows (from the highest risk
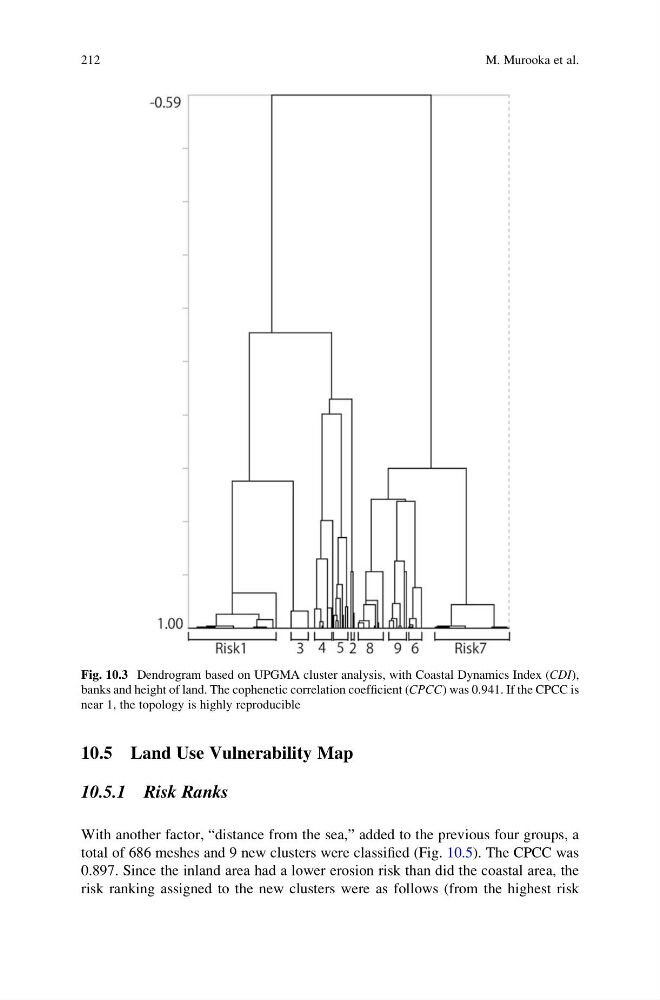
Fig. 10.3 Dendrogram based on UPGMA cluster analysis, with Coastal Dynamics Index (CDI),
banks and height of land. The cophenetic correlation coefficient (CPCC) was 0.941. If the CPCC is
near 1, the topology is highly reproducible
212
M. Murooka et al.
10.5.1 Risk Ranks
With another factor, “distance from the sea,” added to the previous four groups, a
total of 686 meshes and 9 new clusters were classified (Fig. 10.5). The CPCC was
0.897. Since the inland area had a lower erosion risk than did the coastal area, the
risk ranking assigned to the new clusters were as follows (from the highest risk
Fig. 10.3 Dendrogram based on UPGMA cluster analysis, with Coastal Dynamics Index (CDI),
banks and height of land. The cophenetic correlation coefficient (CPCC) was 0.941. If the CPCC is
near 1, the topology is highly reproducible
212
M. Murooka et al.