

10.4.3 Coastal Dynamics Index (CDI)
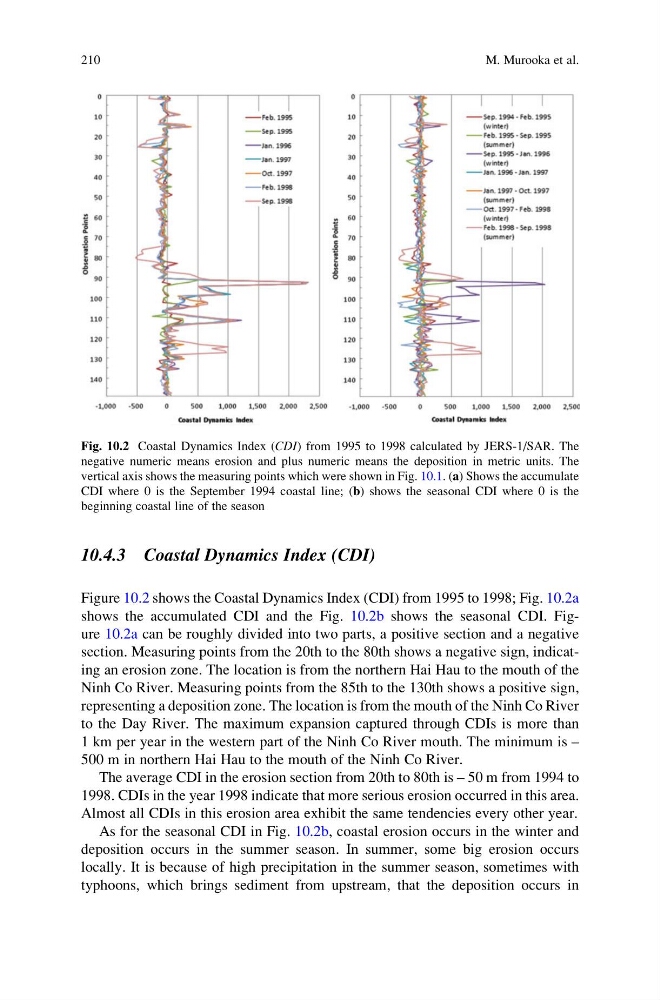
Figure 10.2 shows the Coastal Dynamics Index (CDI) from 1995 to 1998; Fig. 10.2a
shows the accumulated CDI and the Fig. 10.2b shows the seasonal CDI. Figure 10.2a can be roughly divided into two parts, a positive section and a negative
section. Measuring points from the 20th to the 80th shows a negative sign, indicating an erosion zone. The location is from the northern Hai Hau to the mouth of the
Ninh Co River. Measuring points from the 85th to the 130th shows a positive sign,
representing a deposition zone. The location is from the mouth of the Ninh Co River
to the Day River. The maximum expansion captured through CDIs is more than
1 km per year in the western part of the Ninh Co River mouth. The minimum is –
500 m in northern Hai Hau to the mouth of the Ninh Co River.
The average CDI in the erosion section from 20th to 80th is – 50 m from 1994 to
1998. CDIs in the year 1998 indicate that more serious erosion occurred in this area.
Almost all CDIs in this erosion area exhibit the same tendencies every other year.
As for the seasonal CDI in Fig. 10.2b, coastal erosion occurs in the winter and
deposition occurs in the summer season. In summer, some big erosion occurs
locally. It is because of high precipitation in the summer season, sometimes with
typhoons, which brings sediment from upstream, that the deposition occurs in
Fig. 10.2 Coastal Dynamics Index (CDI) from 1995 to 1998 calculated by JERS-1/SAR. The
negative numeric means erosion and plus numeric means the deposition in metric units. The
vertical axis shows the measuring points which were shown in Fig. 10.1. (a) Shows the accumulate
CDI where 0 is the September 1994 coastal line; (b) shows the seasonal CDI where 0 is the
beginning coastal line of the season
210
M. Murooka et al.
Figure 10.2 shows the Coastal Dynamics Index (CDI) from 1995 to 1998; Fig. 10.2a
shows the accumulated CDI and the Fig. 10.2b shows the seasonal CDI. Figure 10.2a can be roughly divided into two parts, a positive section and a negative
section. Measuring points from the 20th to the 80th shows a negative sign, indicating an erosion zone. The location is from the northern Hai Hau to the mouth of the
Ninh Co River. Measuring points from the 85th to the 130th shows a positive sign,
representing a deposition zone. The location is from the mouth of the Ninh Co River
to the Day River. The maximum expansion captured through CDIs is more than
1 km per year in the western part of the Ninh Co River mouth. The minimum is –
500 m in northern Hai Hau to the mouth of the Ninh Co River.
The average CDI in the erosion section from 20th to 80th is – 50 m from 1994 to
1998. CDIs in the year 1998 indicate that more serious erosion occurred in this area.
Almost all CDIs in this erosion area exhibit the same tendencies every other year.
As for the seasonal CDI in Fig. 10.2b, coastal erosion occurs in the winter and
deposition occurs in the summer season. In summer, some big erosion occurs
locally. It is because of high precipitation in the summer season, sometimes with
typhoons, which brings sediment from upstream, that the deposition occurs in
Fig. 10.2 Coastal Dynamics Index (CDI) from 1995 to 1998 calculated by JERS-1/SAR. The
negative numeric means erosion and plus numeric means the deposition in metric units. The
vertical axis shows the measuring points which were shown in Fig. 10.1. (a) Shows the accumulate
CDI where 0 is the September 1994 coastal line; (b) shows the seasonal CDI where 0 is the
beginning coastal line of the season
210
M. Murooka et al.