

Surface elevation change can be easily computed by subtracting multi-temporal
DEMs. A prerequisite is the perfect geometric co-registration of the DEMs
involved. A computer program (Kaufmann and Pl€ osch 2000) was used to exploit
the available data, i.e. DEMs and glacier masks, following glaciological standards
and needs. Outputs are hypsometric curves of the glacier (Fig. 9.5), detailed
information on glacier elevation/volume change for discrete altitude intervals
(Fig. 9.6), and other glaciological parameters.
9.3.2.7 Evolution of the Supraglacial Debris Cover and Meltwater
Channels
A supervised classification was performed within ArcGIS 10.1 in order to differentiate between debris-covered glacier parts and bare-ice parts. This approach
involves manually selecting training areas for the categories to be mapped in
order to develop the spectral signatures of these classes (Ka ¨a ¨b 2005). The aerial
photographs for 2003, 2006 and 2009 contain no thermal information but only the
three color bands RGB. Thermal and multispectral remote sensing information of
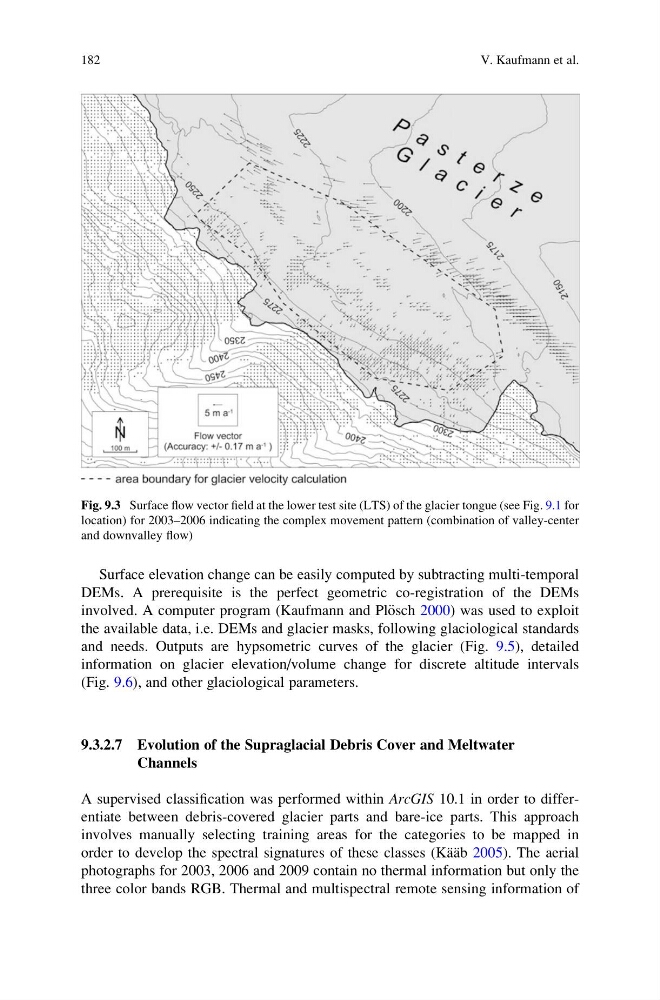
Fig. 9.3 Surface flow vector field at the lower test site (LTS) of the glacier tongue (see Fig. 9.1 for
location) for 2003–2006 indicating the complex movement pattern (combination of valley-center
and downvalley flow)
182
V. Kaufmann et al.
DEMs. A prerequisite is the perfect geometric co-registration of the DEMs
involved. A computer program (Kaufmann and Pl€ osch 2000) was used to exploit
the available data, i.e. DEMs and glacier masks, following glaciological standards
and needs. Outputs are hypsometric curves of the glacier (Fig. 9.5), detailed
information on glacier elevation/volume change for discrete altitude intervals
(Fig. 9.6), and other glaciological parameters.
9.3.2.7 Evolution of the Supraglacial Debris Cover and Meltwater
Channels
A supervised classification was performed within ArcGIS 10.1 in order to differentiate between debris-covered glacier parts and bare-ice parts. This approach
involves manually selecting training areas for the categories to be mapped in
order to develop the spectral signatures of these classes (Ka ¨a ¨b 2005). The aerial
photographs for 2003, 2006 and 2009 contain no thermal information but only the
three color bands RGB. Thermal and multispectral remote sensing information of
Fig. 9.3 Surface flow vector field at the lower test site (LTS) of the glacier tongue (see Fig. 9.1 for
location) for 2003–2006 indicating the complex movement pattern (combination of valley-center
and downvalley flow)
182
V. Kaufmann et al.