

function of foliar C:N ratio. As foliar C:N ratio values changes from 5 to 45, the
modelled NPP varies from 44 to 120 g C m
À2 years
À1 on average, from 46 to 136 g
C m
À2 years
À1 for a site with high vegetation cover, and from 44 to 92 g C m
À2
years
À1 for a site with low vegetation cover.
The model has a similar response to prescribed changes in foliar C:N ratio. In
general, modeled NPP increases greatly when the foliar C:N value is less than
15, and has marginal variation when foliar C:N values vary between 15 and 33, and
either increases or decreases under higher foliar C:N values. Consistently, higher
simulated NPP always appears in the site with higher vegetation cover (the site
VG2D), and lower simulated NPP always appears in the site with lower vegetation
cover (e.g. the site VG13D).
Results from sensitivity analysis of simulated NPP to foliar C:N parameter
reveal that spatial BIOME-BGC model is strongly sensitive to the critical parameter
foliar C:N ratio, especially when foliar C:N value is high or low.
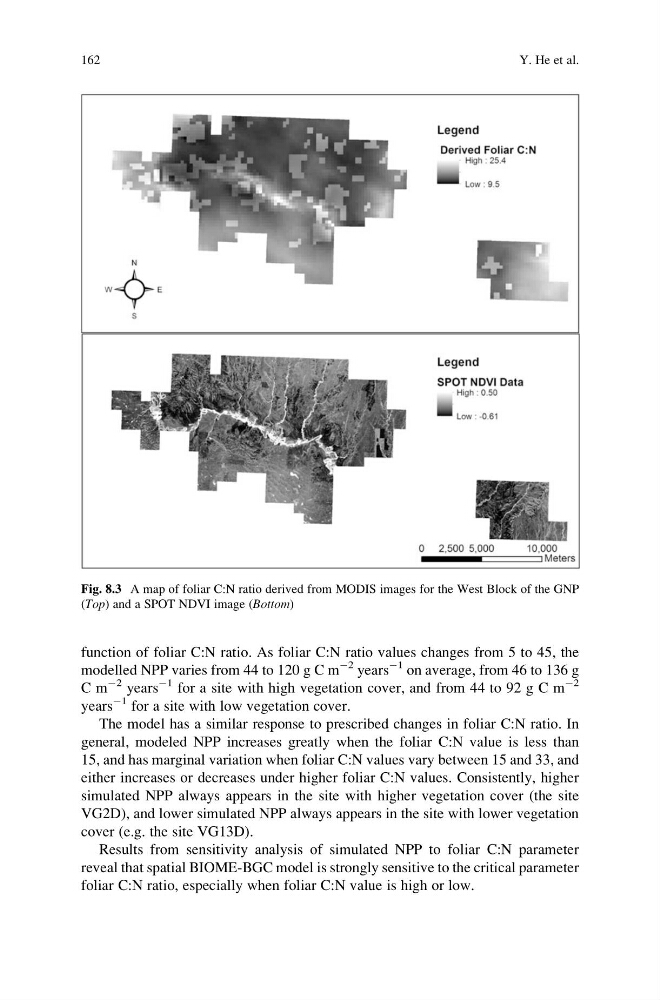
Fig. 8.3 A map of foliar C:N ratio derived from MODIS images for the West Block of the GNP
(Top) and a SPOT NDVI image (Bottom)
162
Y. He et al.
modelled NPP varies from 44 to 120 g C m
À2 years
À1 on average, from 46 to 136 g
C m
À2 years
À1 for a site with high vegetation cover, and from 44 to 92 g C m
À2
years
À1 for a site with low vegetation cover.
The model has a similar response to prescribed changes in foliar C:N ratio. In
general, modeled NPP increases greatly when the foliar C:N value is less than
15, and has marginal variation when foliar C:N values vary between 15 and 33, and
either increases or decreases under higher foliar C:N values. Consistently, higher
simulated NPP always appears in the site with higher vegetation cover (the site
VG2D), and lower simulated NPP always appears in the site with lower vegetation
cover (e.g. the site VG13D).
Results from sensitivity analysis of simulated NPP to foliar C:N parameter
reveal that spatial BIOME-BGC model is strongly sensitive to the critical parameter
foliar C:N ratio, especially when foliar C:N value is high or low.
Fig. 8.3 A map of foliar C:N ratio derived from MODIS images for the West Block of the GNP
(Top) and a SPOT NDVI image (Bottom)
162
Y. He et al.